System Health (Enterprise)
Introduction
System Health visualizes and provides alerting on overall system metrics, including CPU, Memory, and Disk utilization. Alerting frequency and thresholds can be adjusted through the System Health configurations.
Metrics Displayed
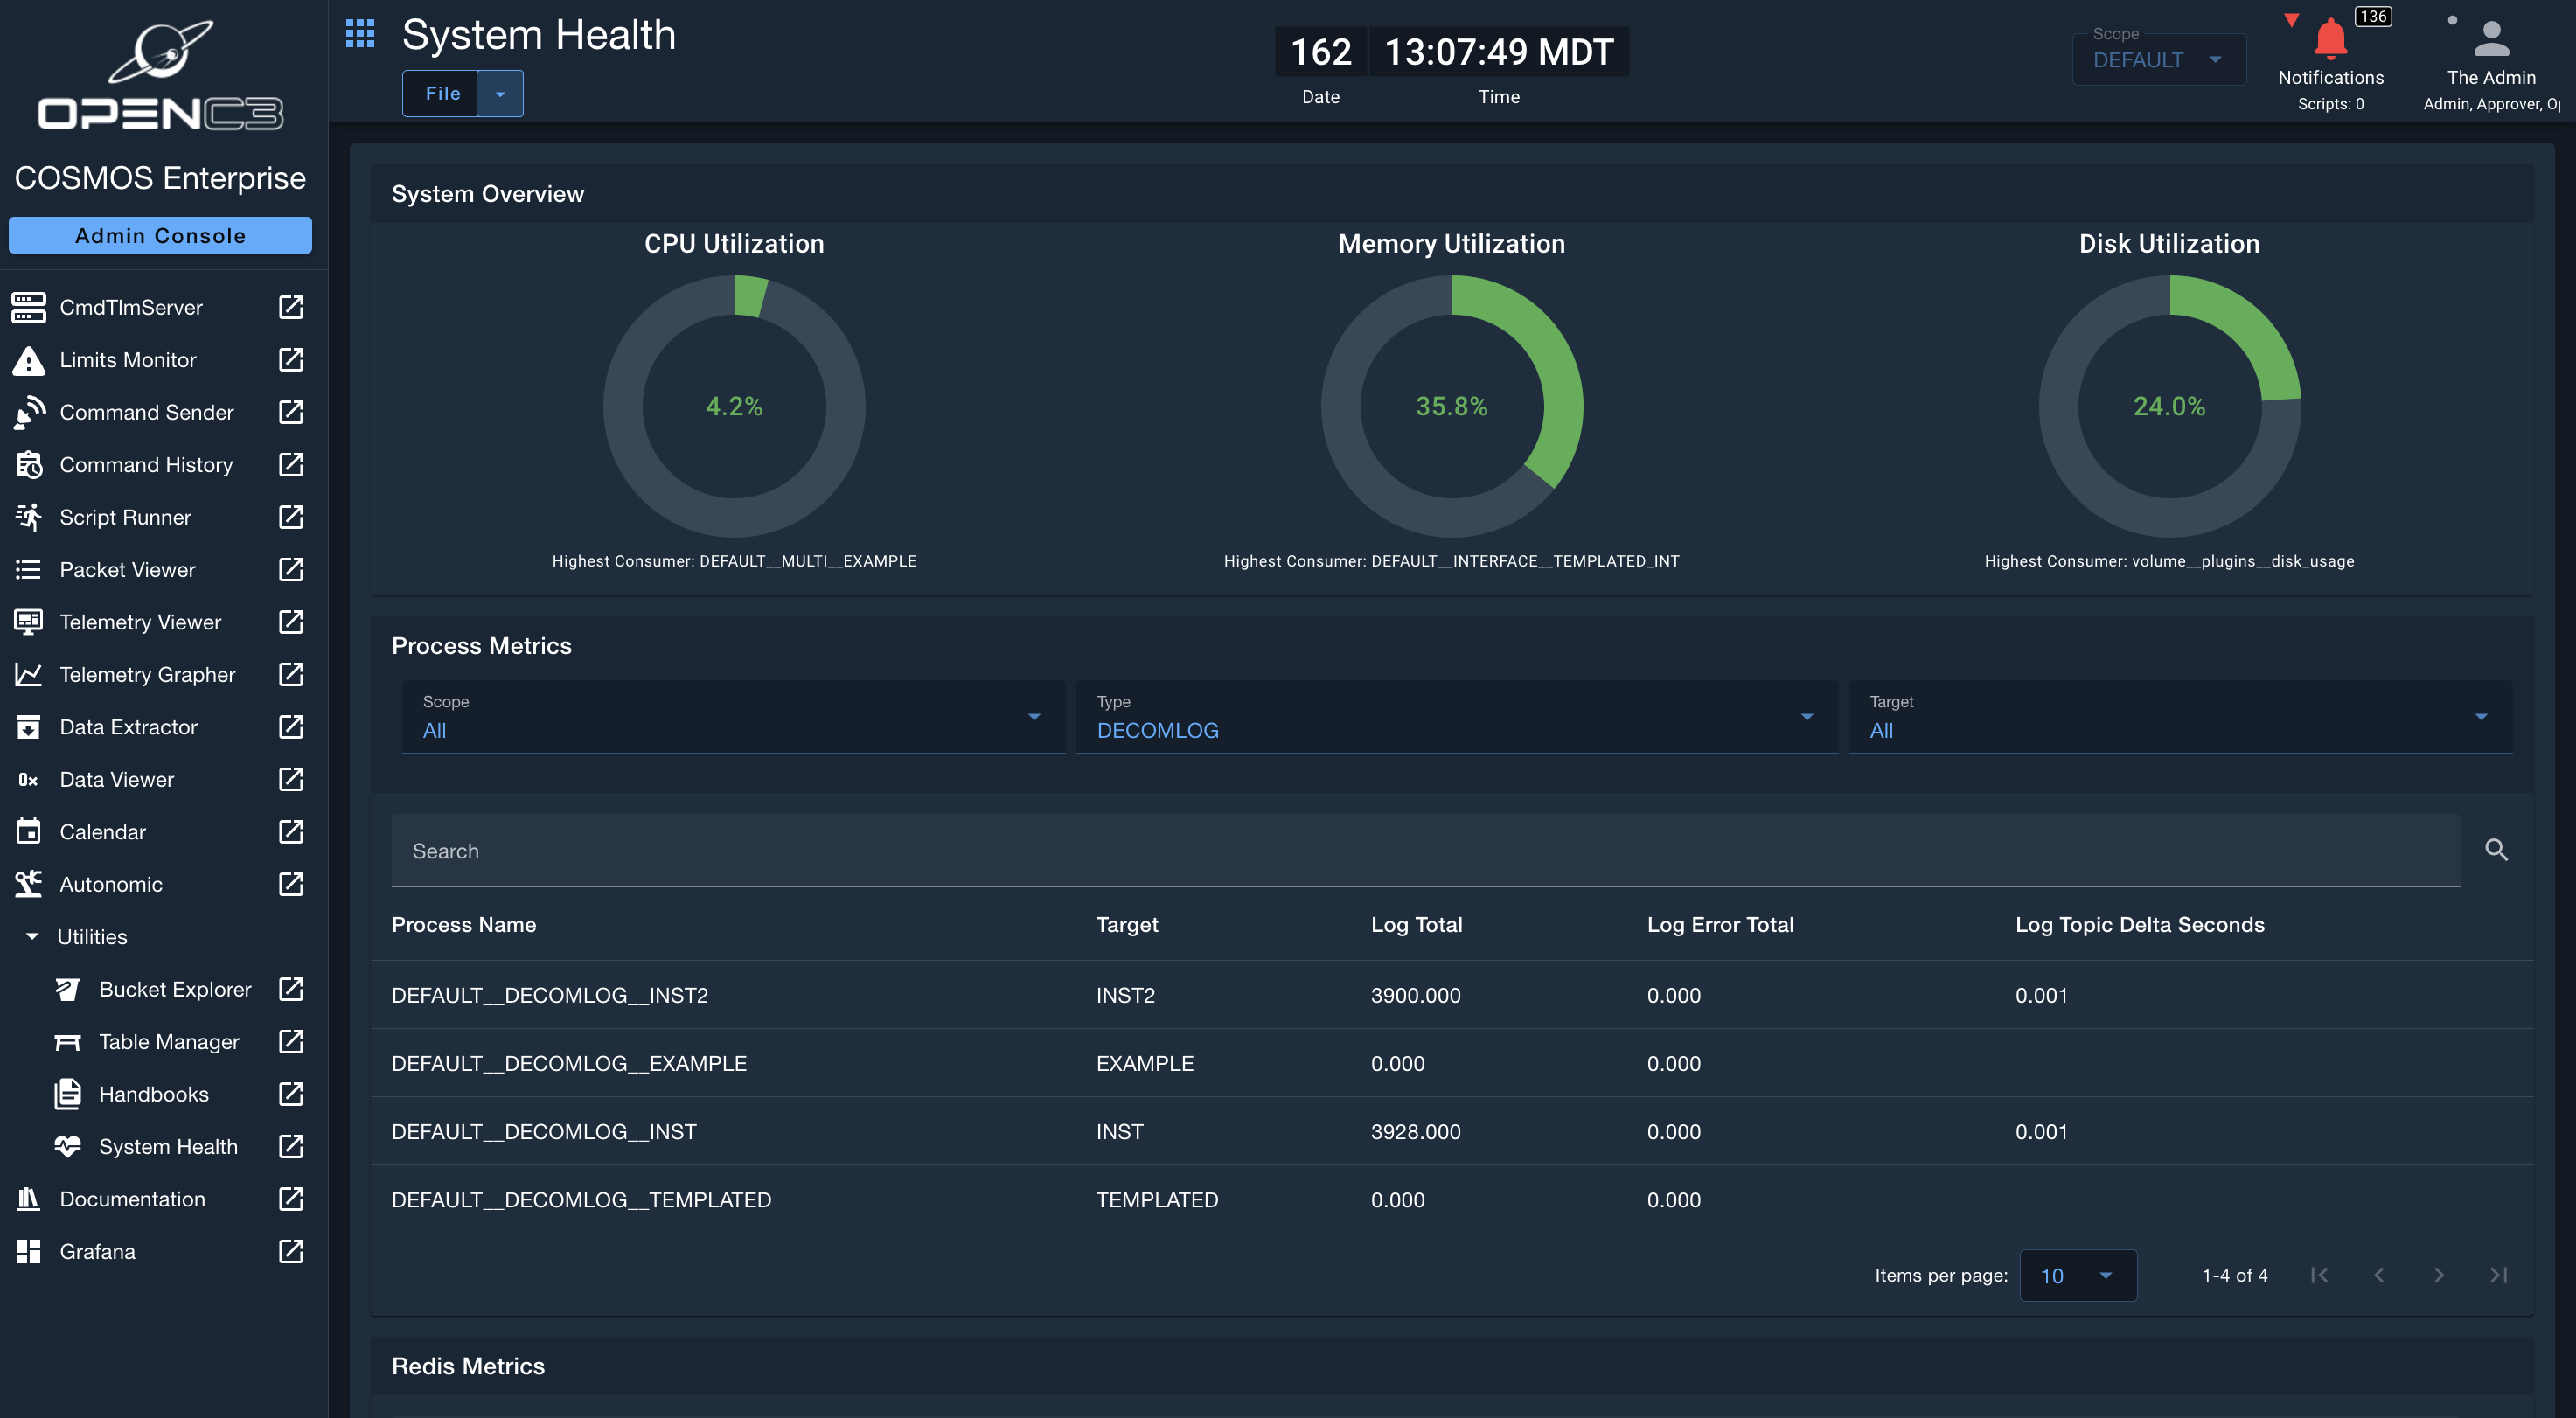
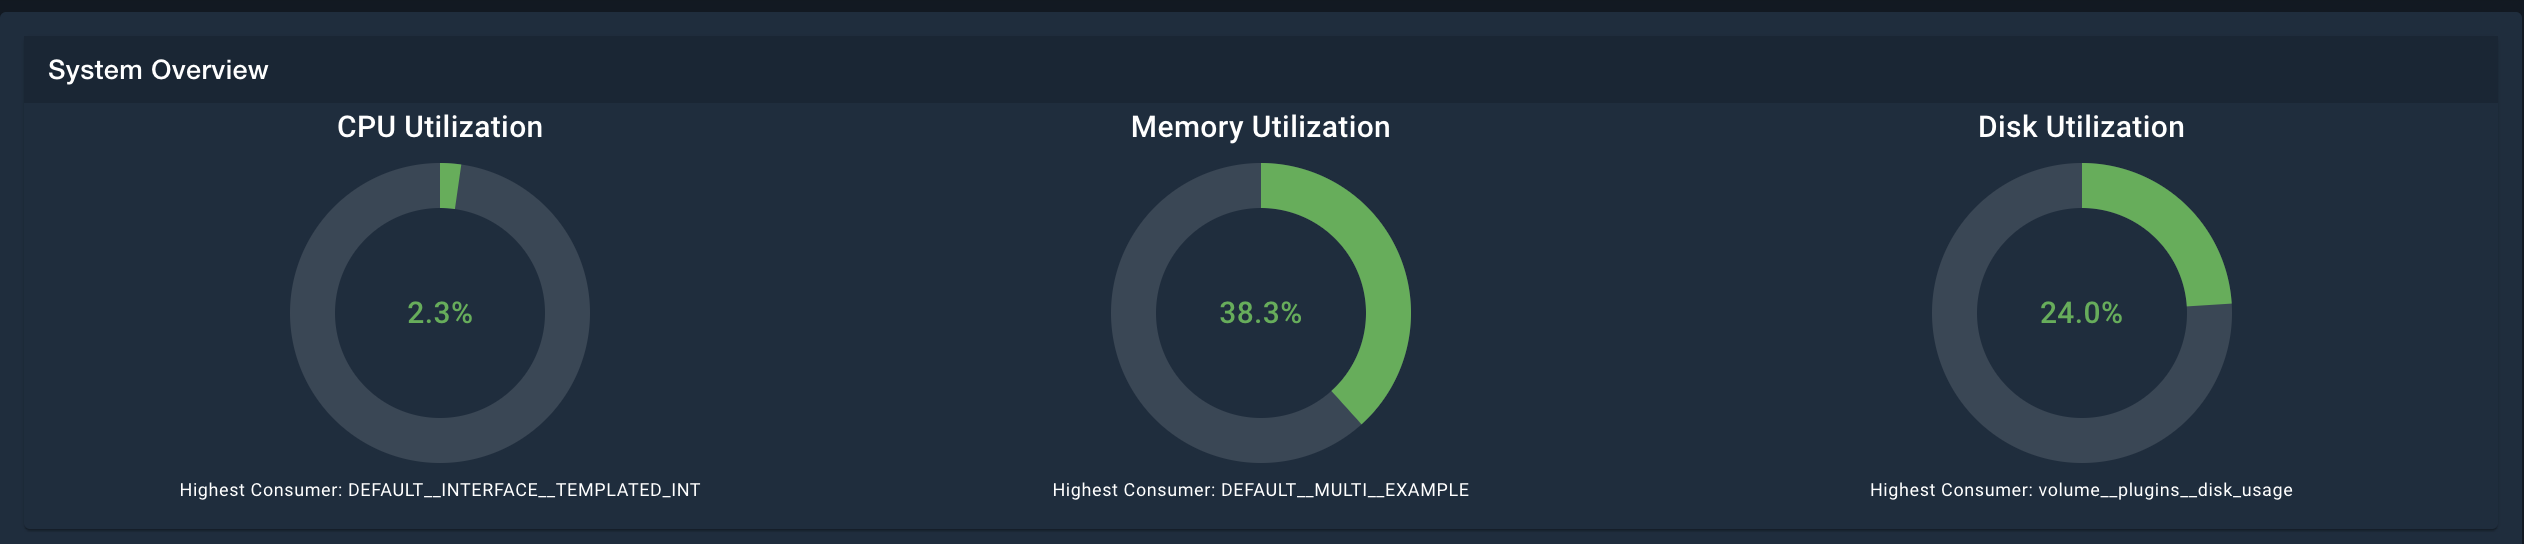
System Overview Gauges
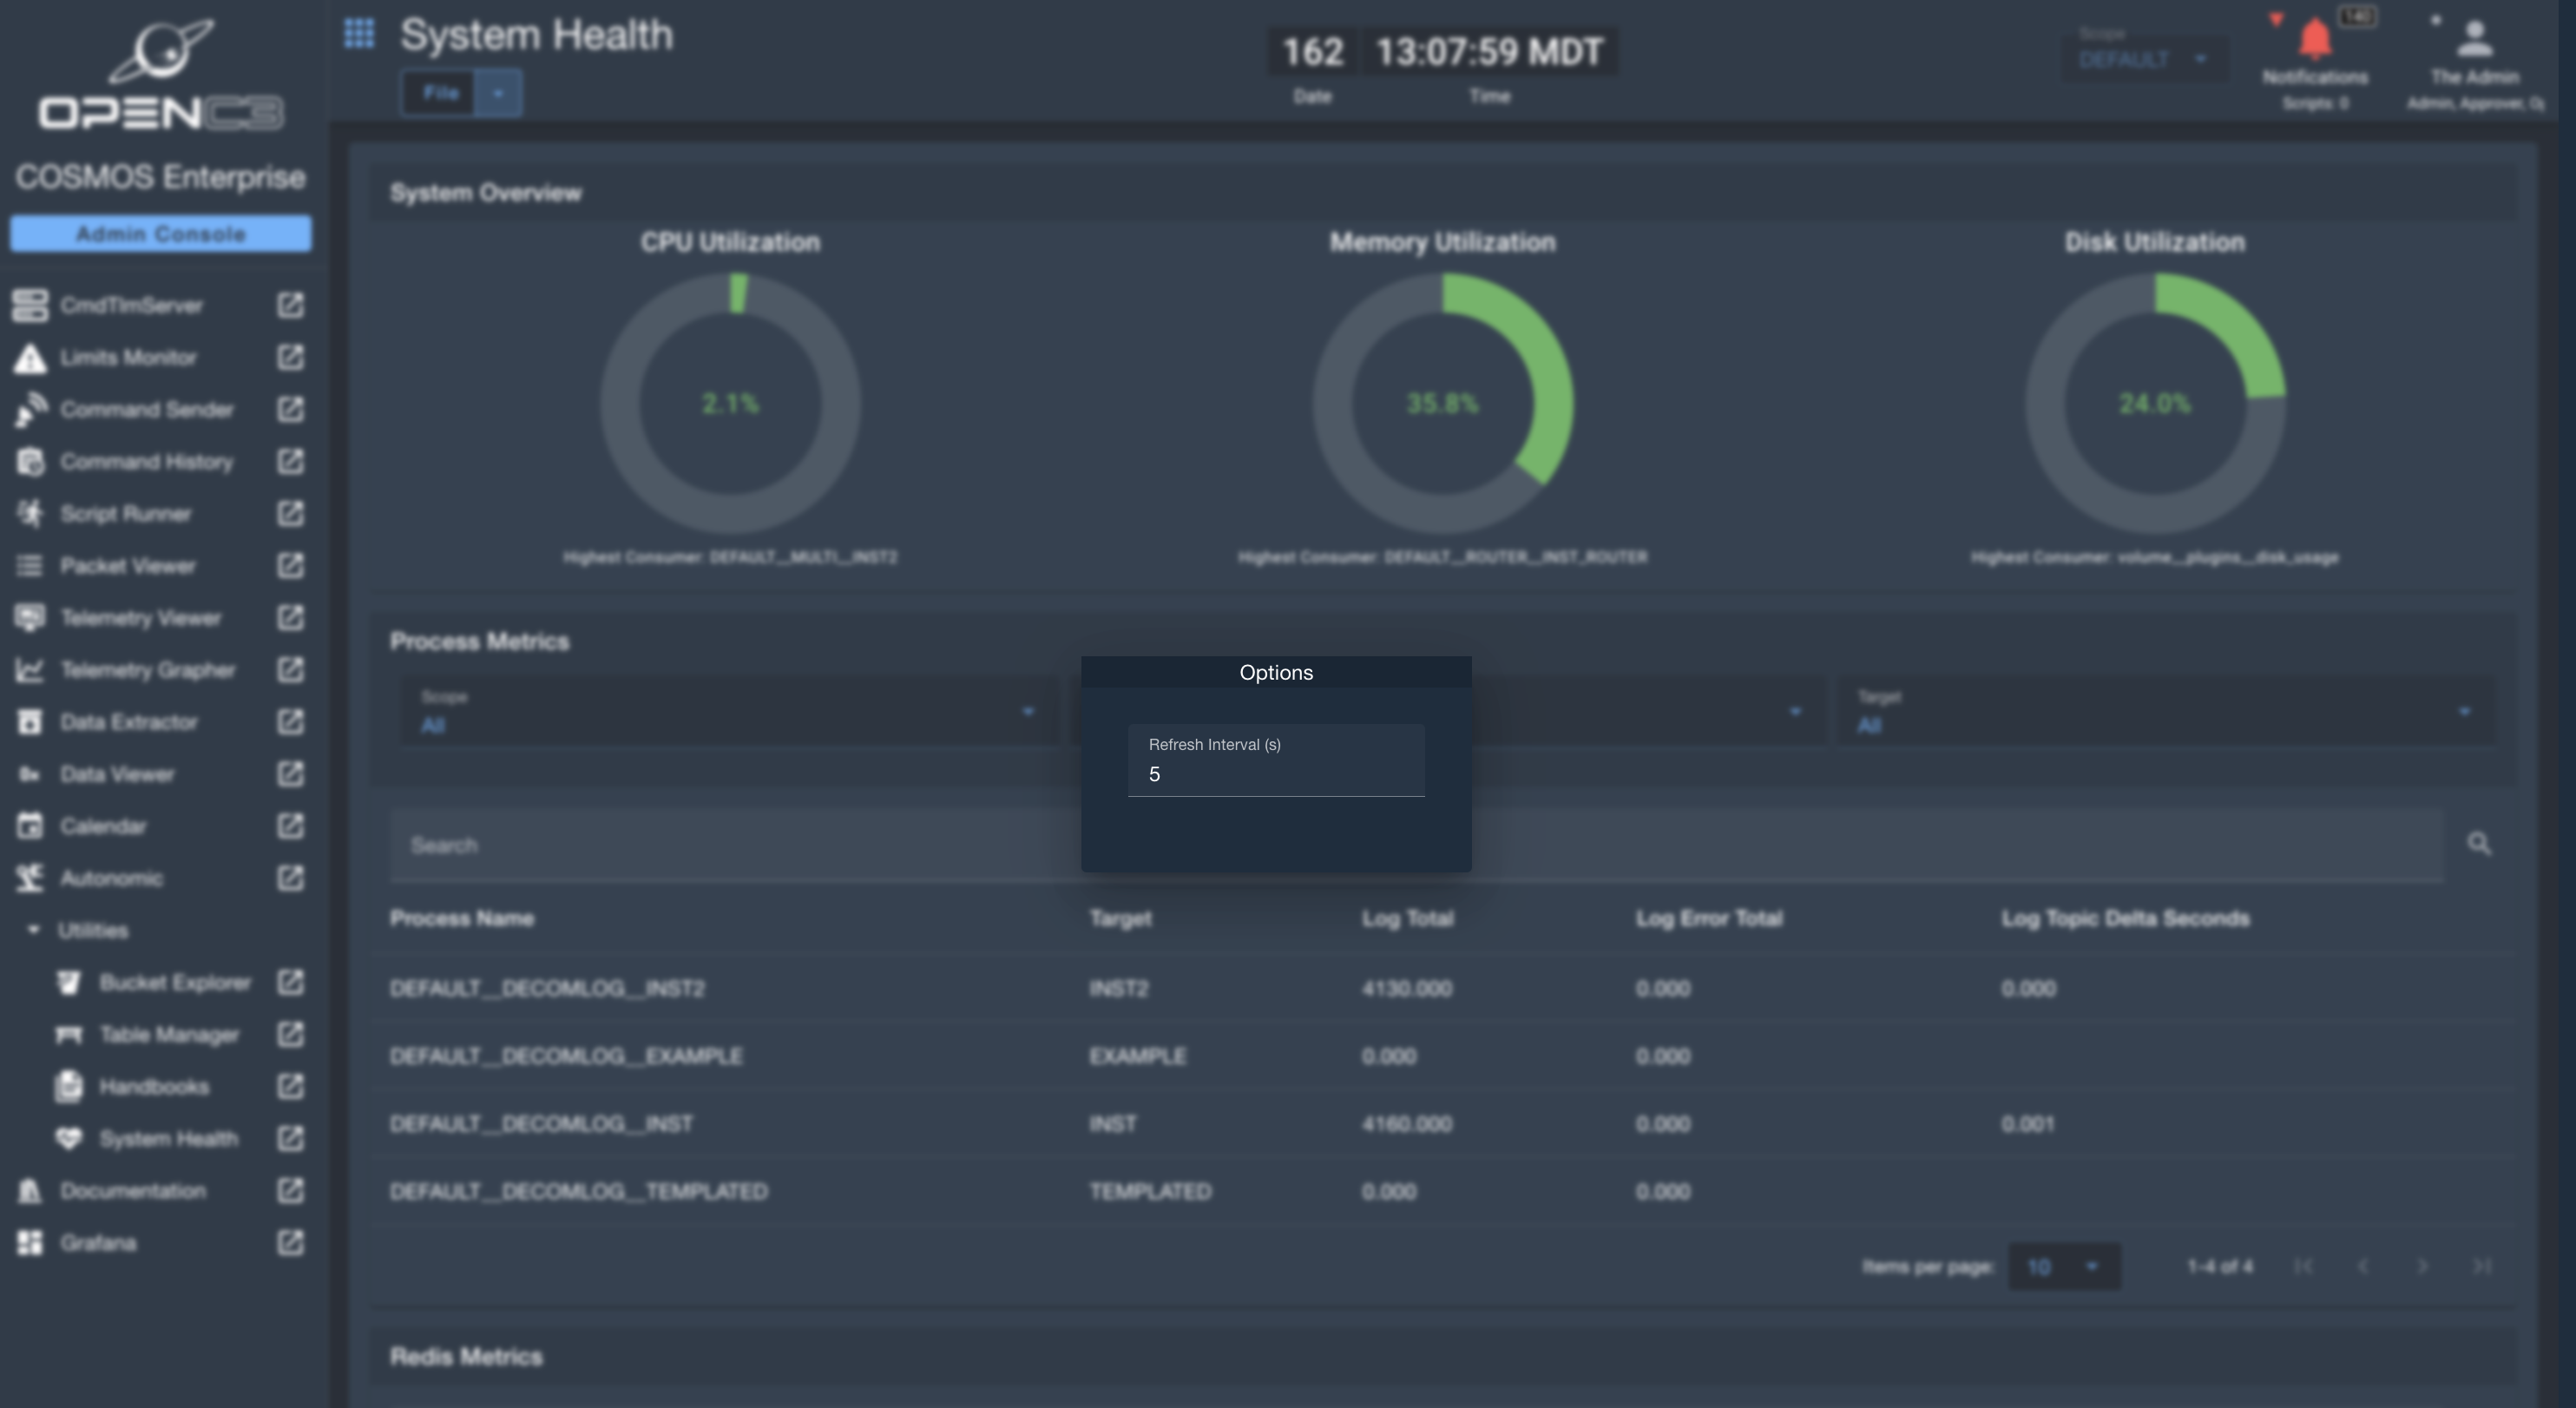
At the top, there are three gauges displayed, which show the worst performing nodes in CPU, Memory, and Disk utilization. This is give a quick glance as to how the overall system metrics look like. The gauges will turn green (healthy), yellow (warning), and red (excessive utilization) according to the thresholds defined in the System Health configurations. Below the individual gauges, the node / microservice that is causing the highest utilization is displayed.
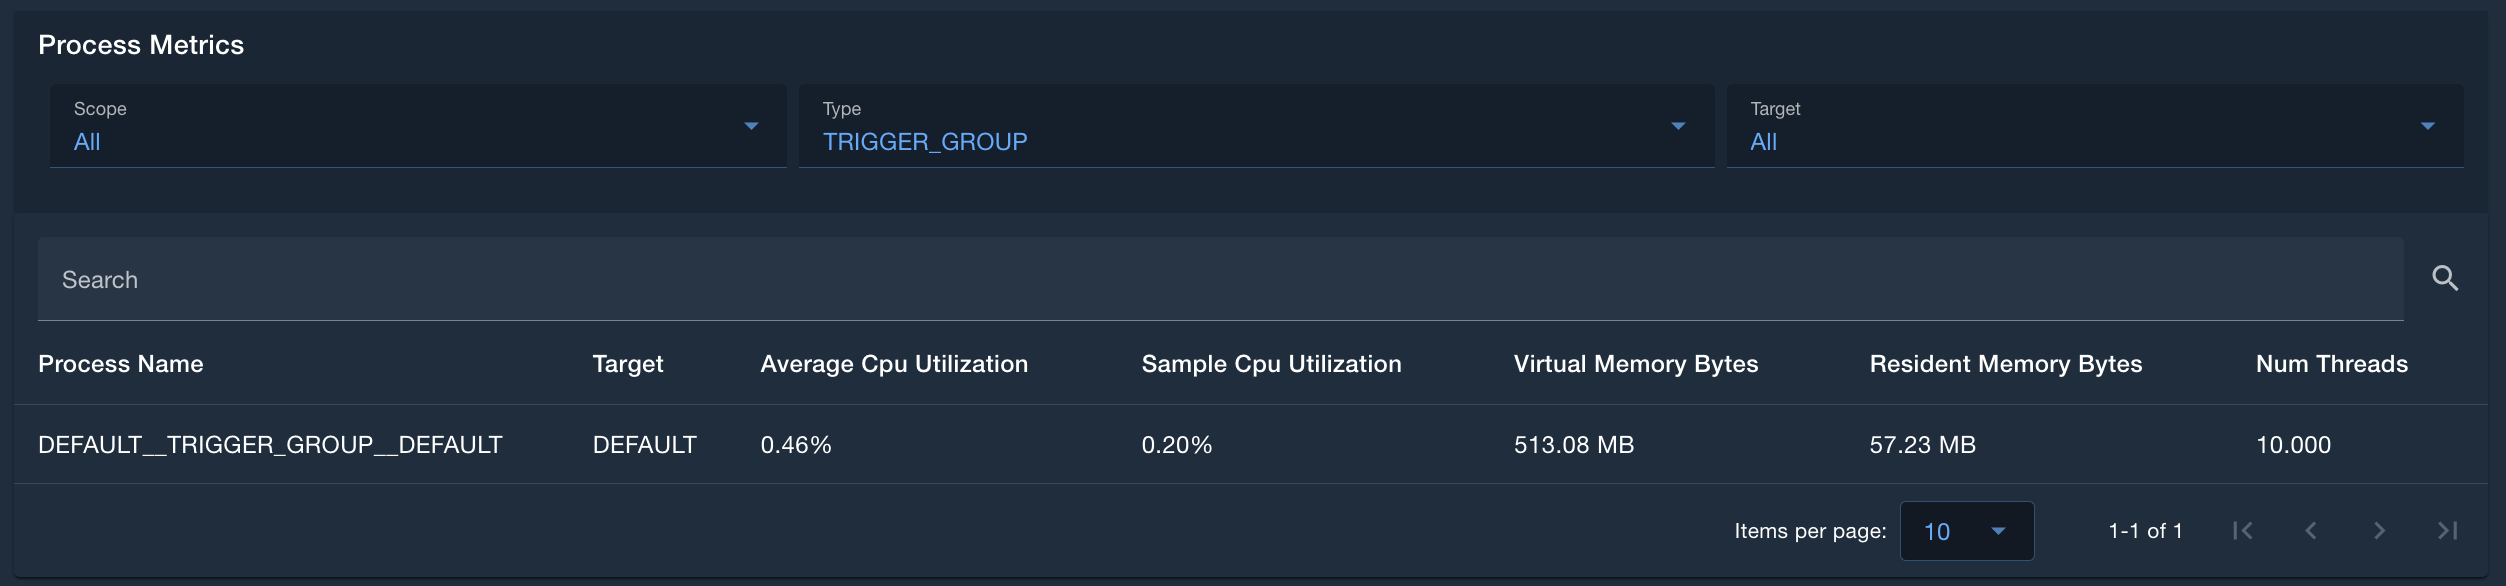
Process Metrics
The Process Metrics table displays metrics for the various processes. Users can filter on the scope, type of process, and target, as well as search, sort, and paginate on the table. Depending on the process type, the headers of each column will be different, as different processes report different types of metrics. This table can be used to deep-dive into individual process performance.
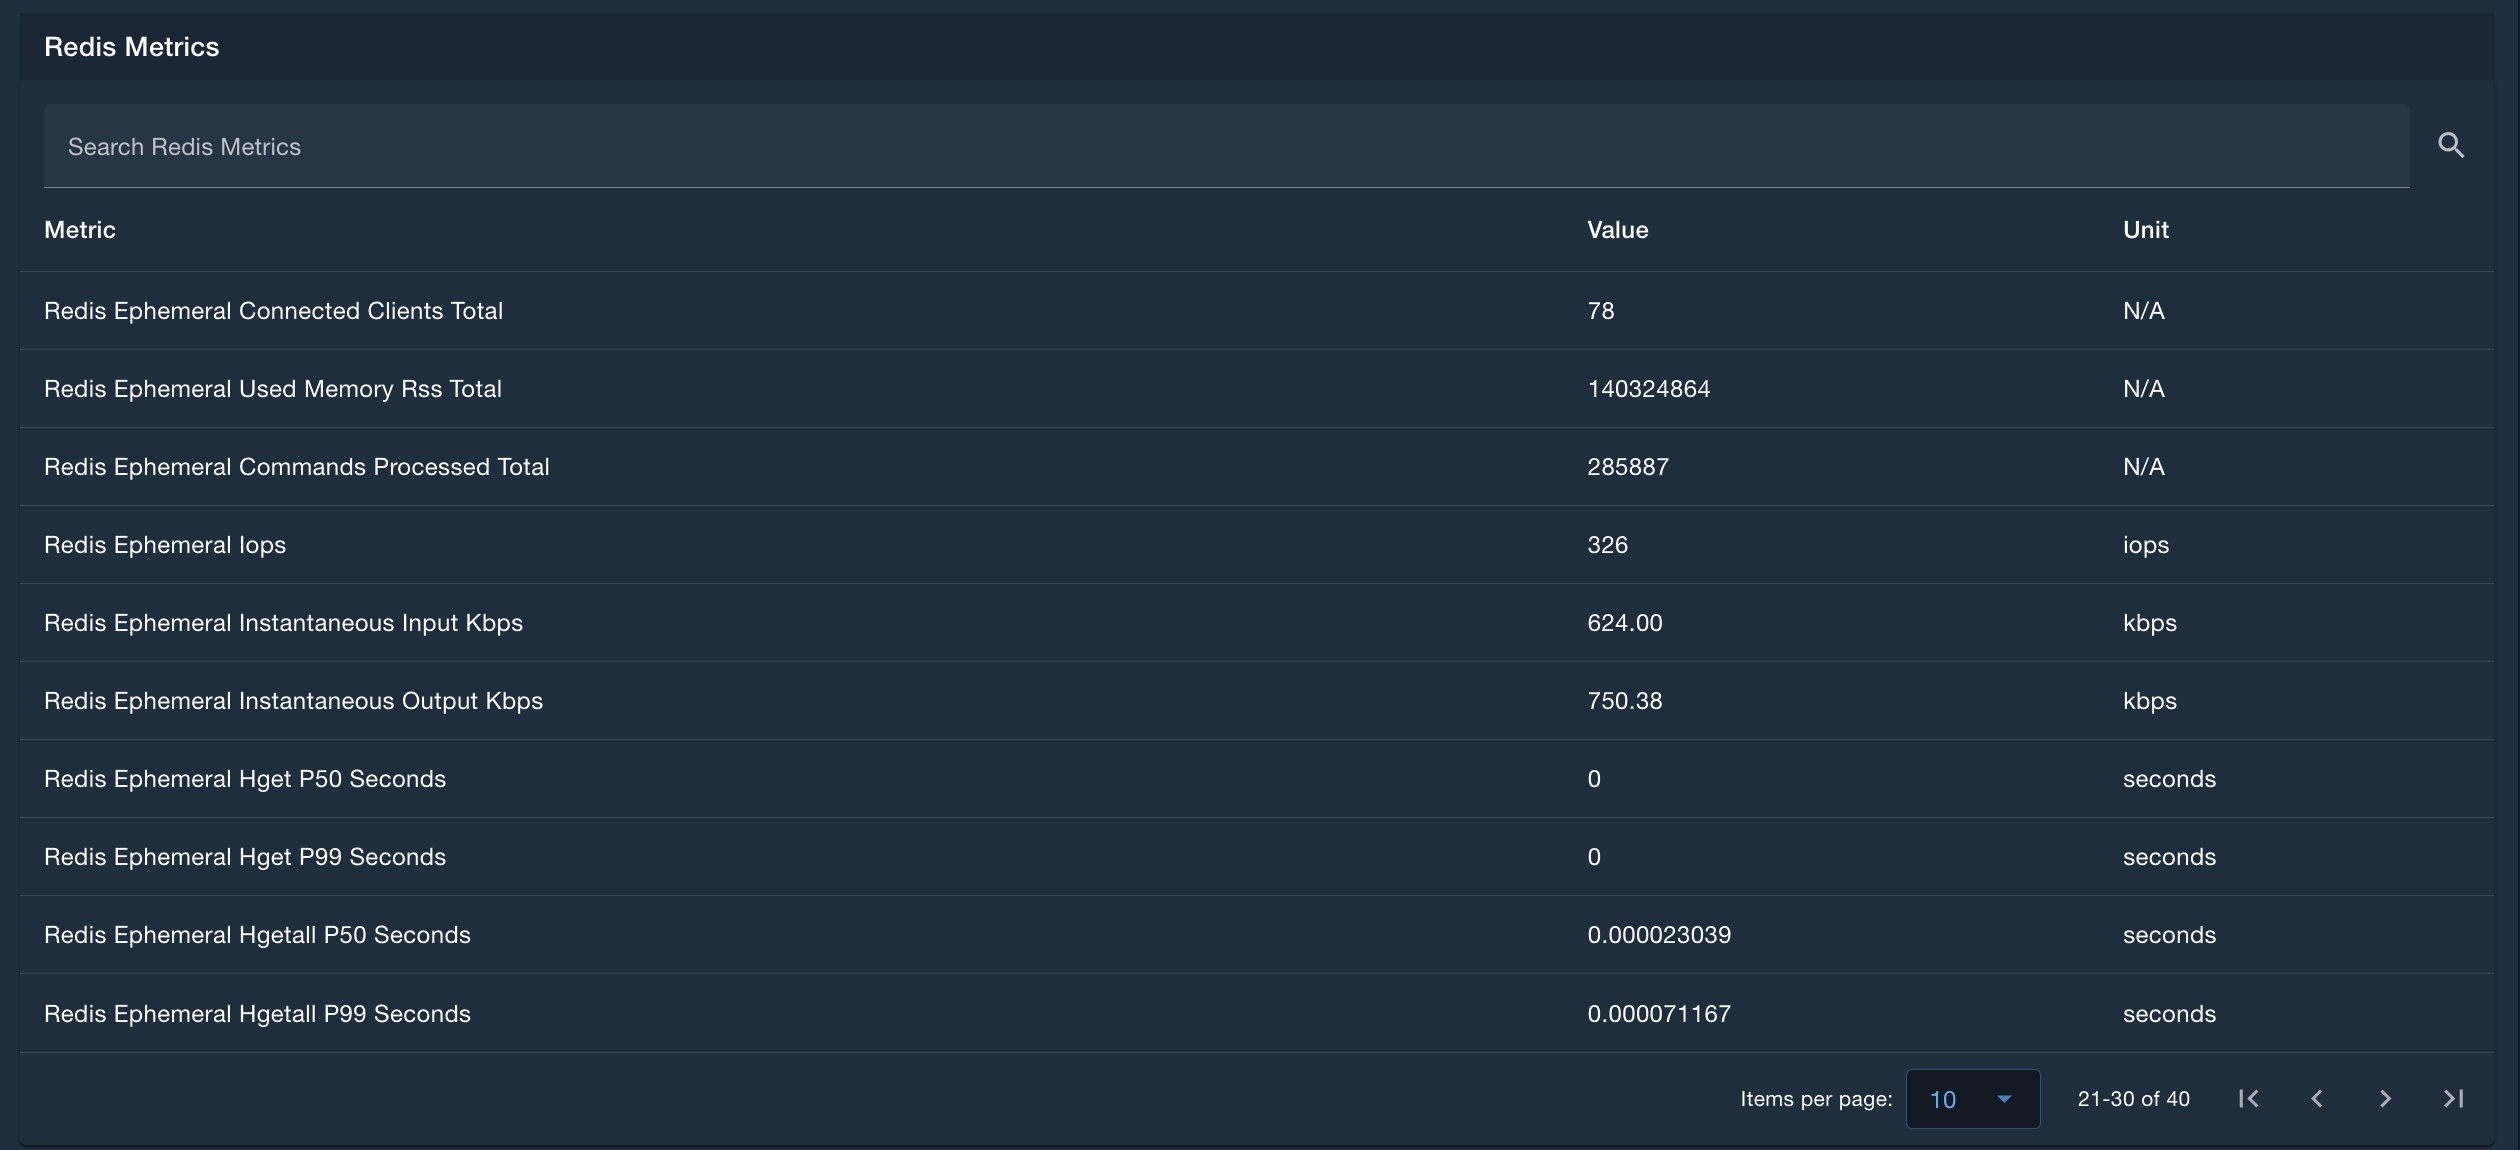
Redis Metrics
The Redis Metrics table provides in-depth metrics of Redis performance, including IOPS and operation speeds. This table is searchable, sortable, and pageable.
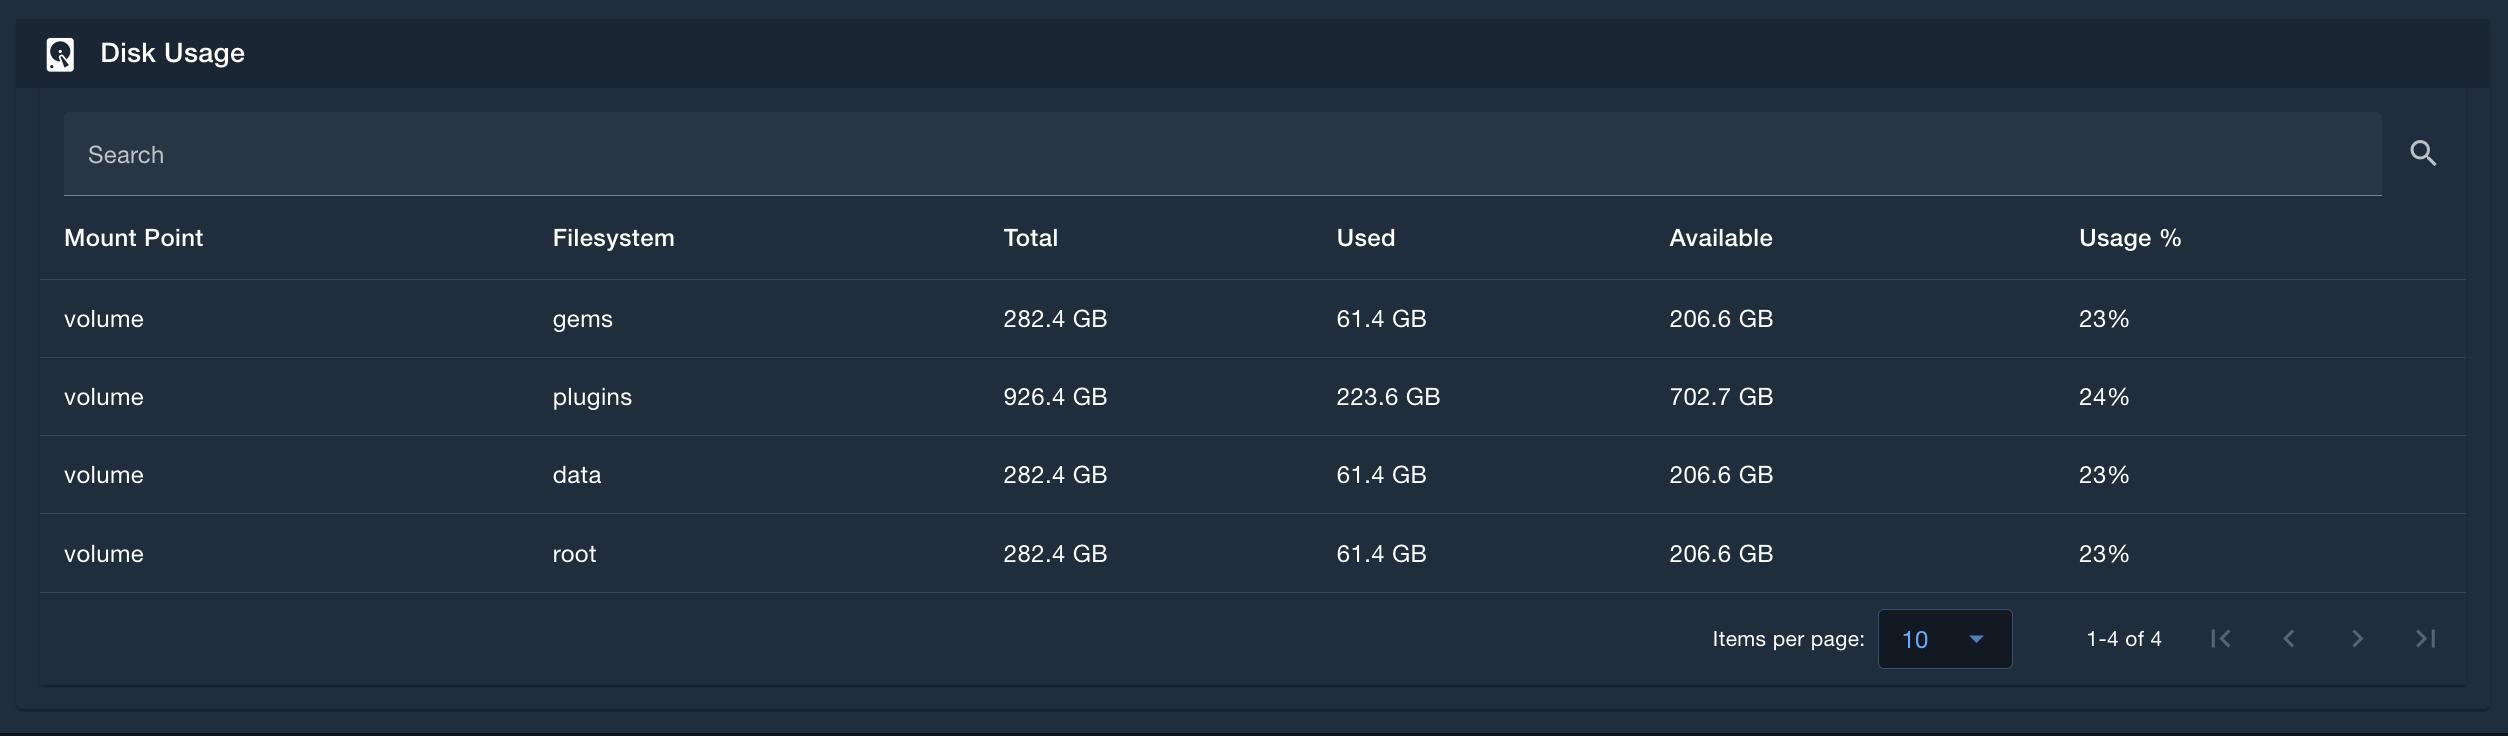
Disk Usage
The Disk Usage table provides in-depth metrics of Disk Usage of each node (if deployed to a Kubernetes environment and the nodeDiskMetricsDaemonset is enabled) and the /gems, /plugins, /data, and / (root) volumes. This table provides metrics on how much disk space is available and used on each of these mount points. This table is searchable, sortable, and pageable.
Configurations
Configurations are only available for Admins.
Refresh Interval
The refresh interval sets a timer for how often the page is automatically refreshed to provide the latest metrics on System Health. The default is set to 5 seconds, and can be adjusted from the File -> Options menu.
System Health Configurations
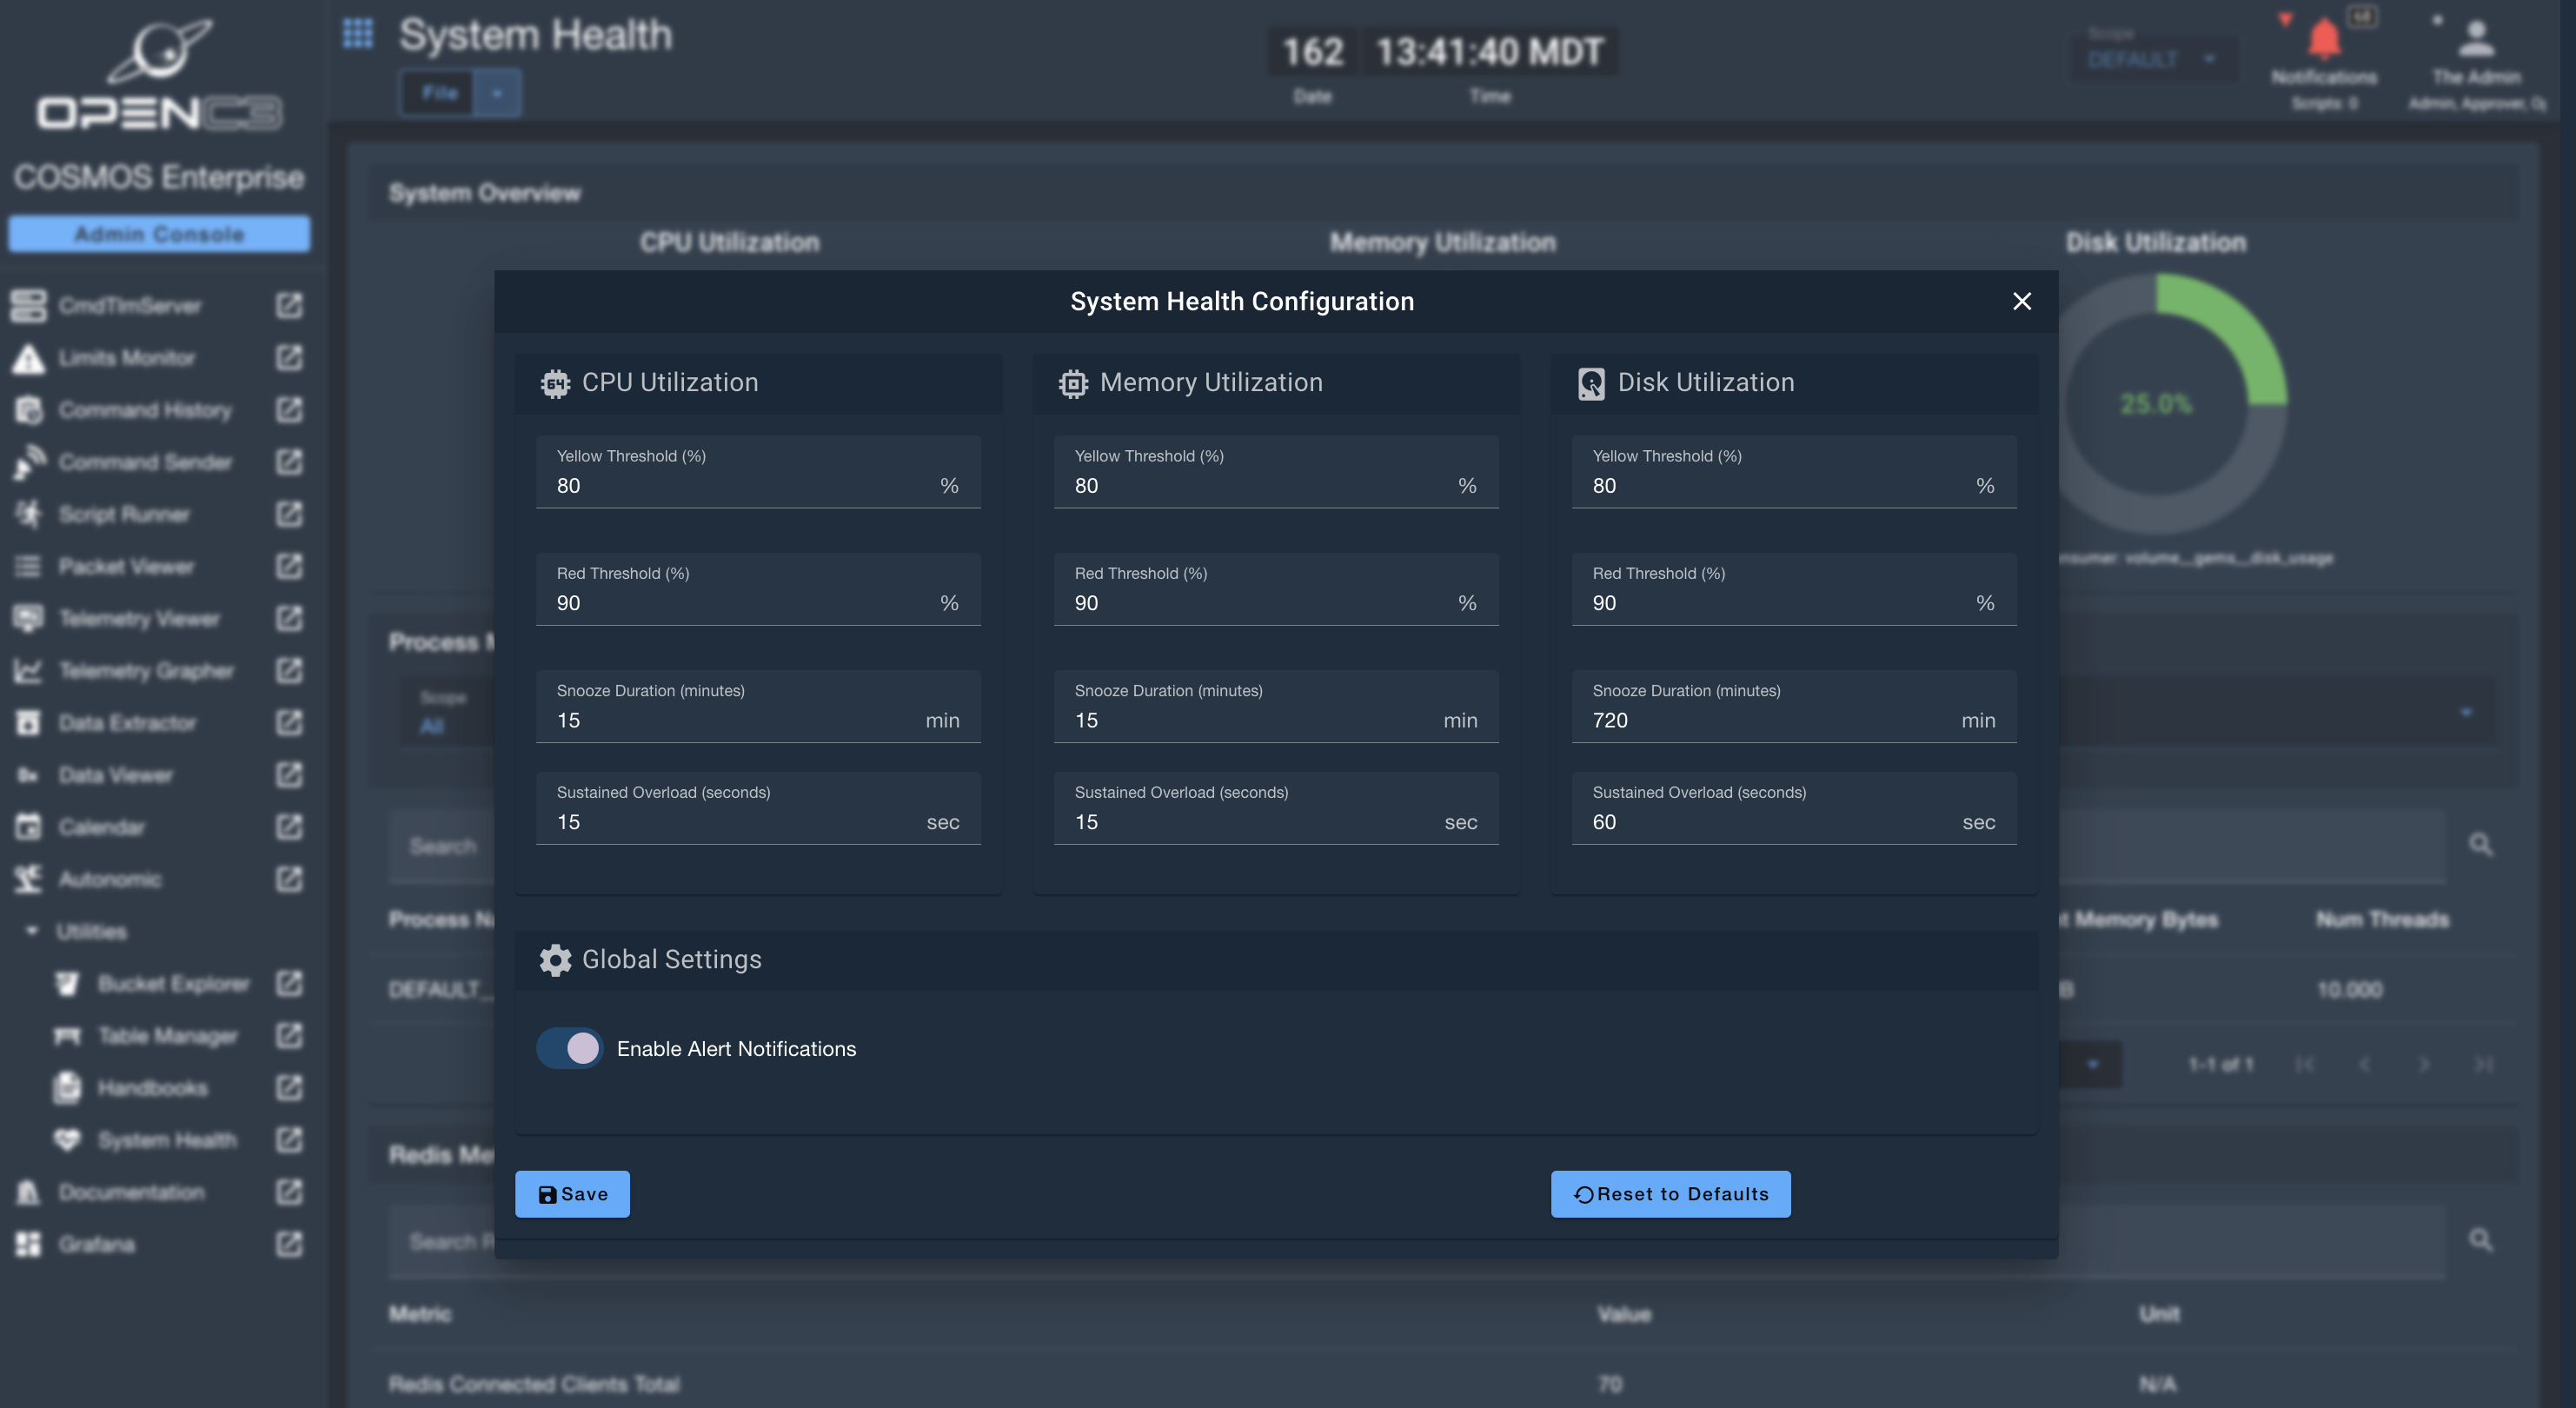
The System Health configurations allow admins to change the yellow/red thresholds, enable/disable notifications, snooze duration, and sustained overload period for CPU, Memory, and Disk Utilization. The default configurations can be adjusted from the File -> Configurations menu.
- Yellow Threshold: The percent (%) utilization needed to exceed to trigger a "warning" notification, and sets gauge colors to yellow.
- Red Threshold: The percent (%) utilization needed to exceed to trigger an "error" notification, and set gauge colors to red.
- Snooze Duration: Number of minutes to snooze notifications after a threshold is hit. (Example: with a 15 minute snooze, if CPU utilization hits 100% consistently for an hour, the notification would get triggered a total of 4 times (every 15 minutes)).
- Sustained Overload: Number of seconds that the threshold would have to be met by a single service in order for the notification to trigger. This prevents noisy notifications, as CPU / Memory spikes can be normal (while sustained overload is suggests an anomaly).
- Enable Alert Notifications: Enable or disable the alert notifications on system health. System Health will continue to be monitored and tracked, but the notifications will not be triggered.
Alerting Mechanism
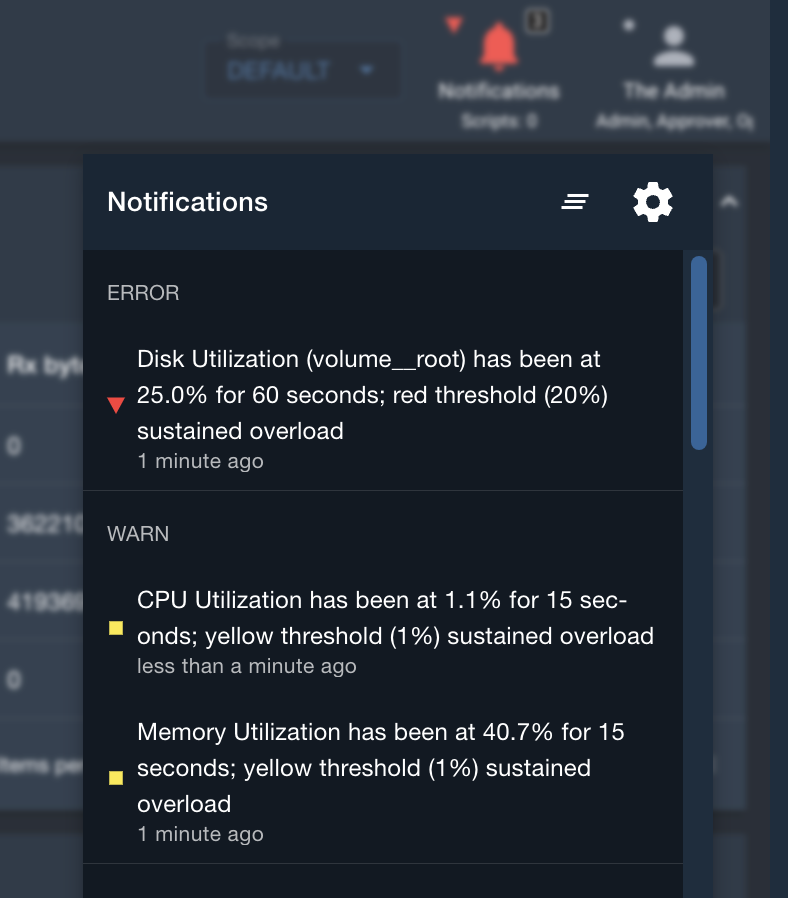
If alert notifications are enabled through the System Health configurations, users of COSMOS will receive notifications if the yellow/red thresholds for CPU/Memory/Disk are met for a specified sustained duration.
Notification
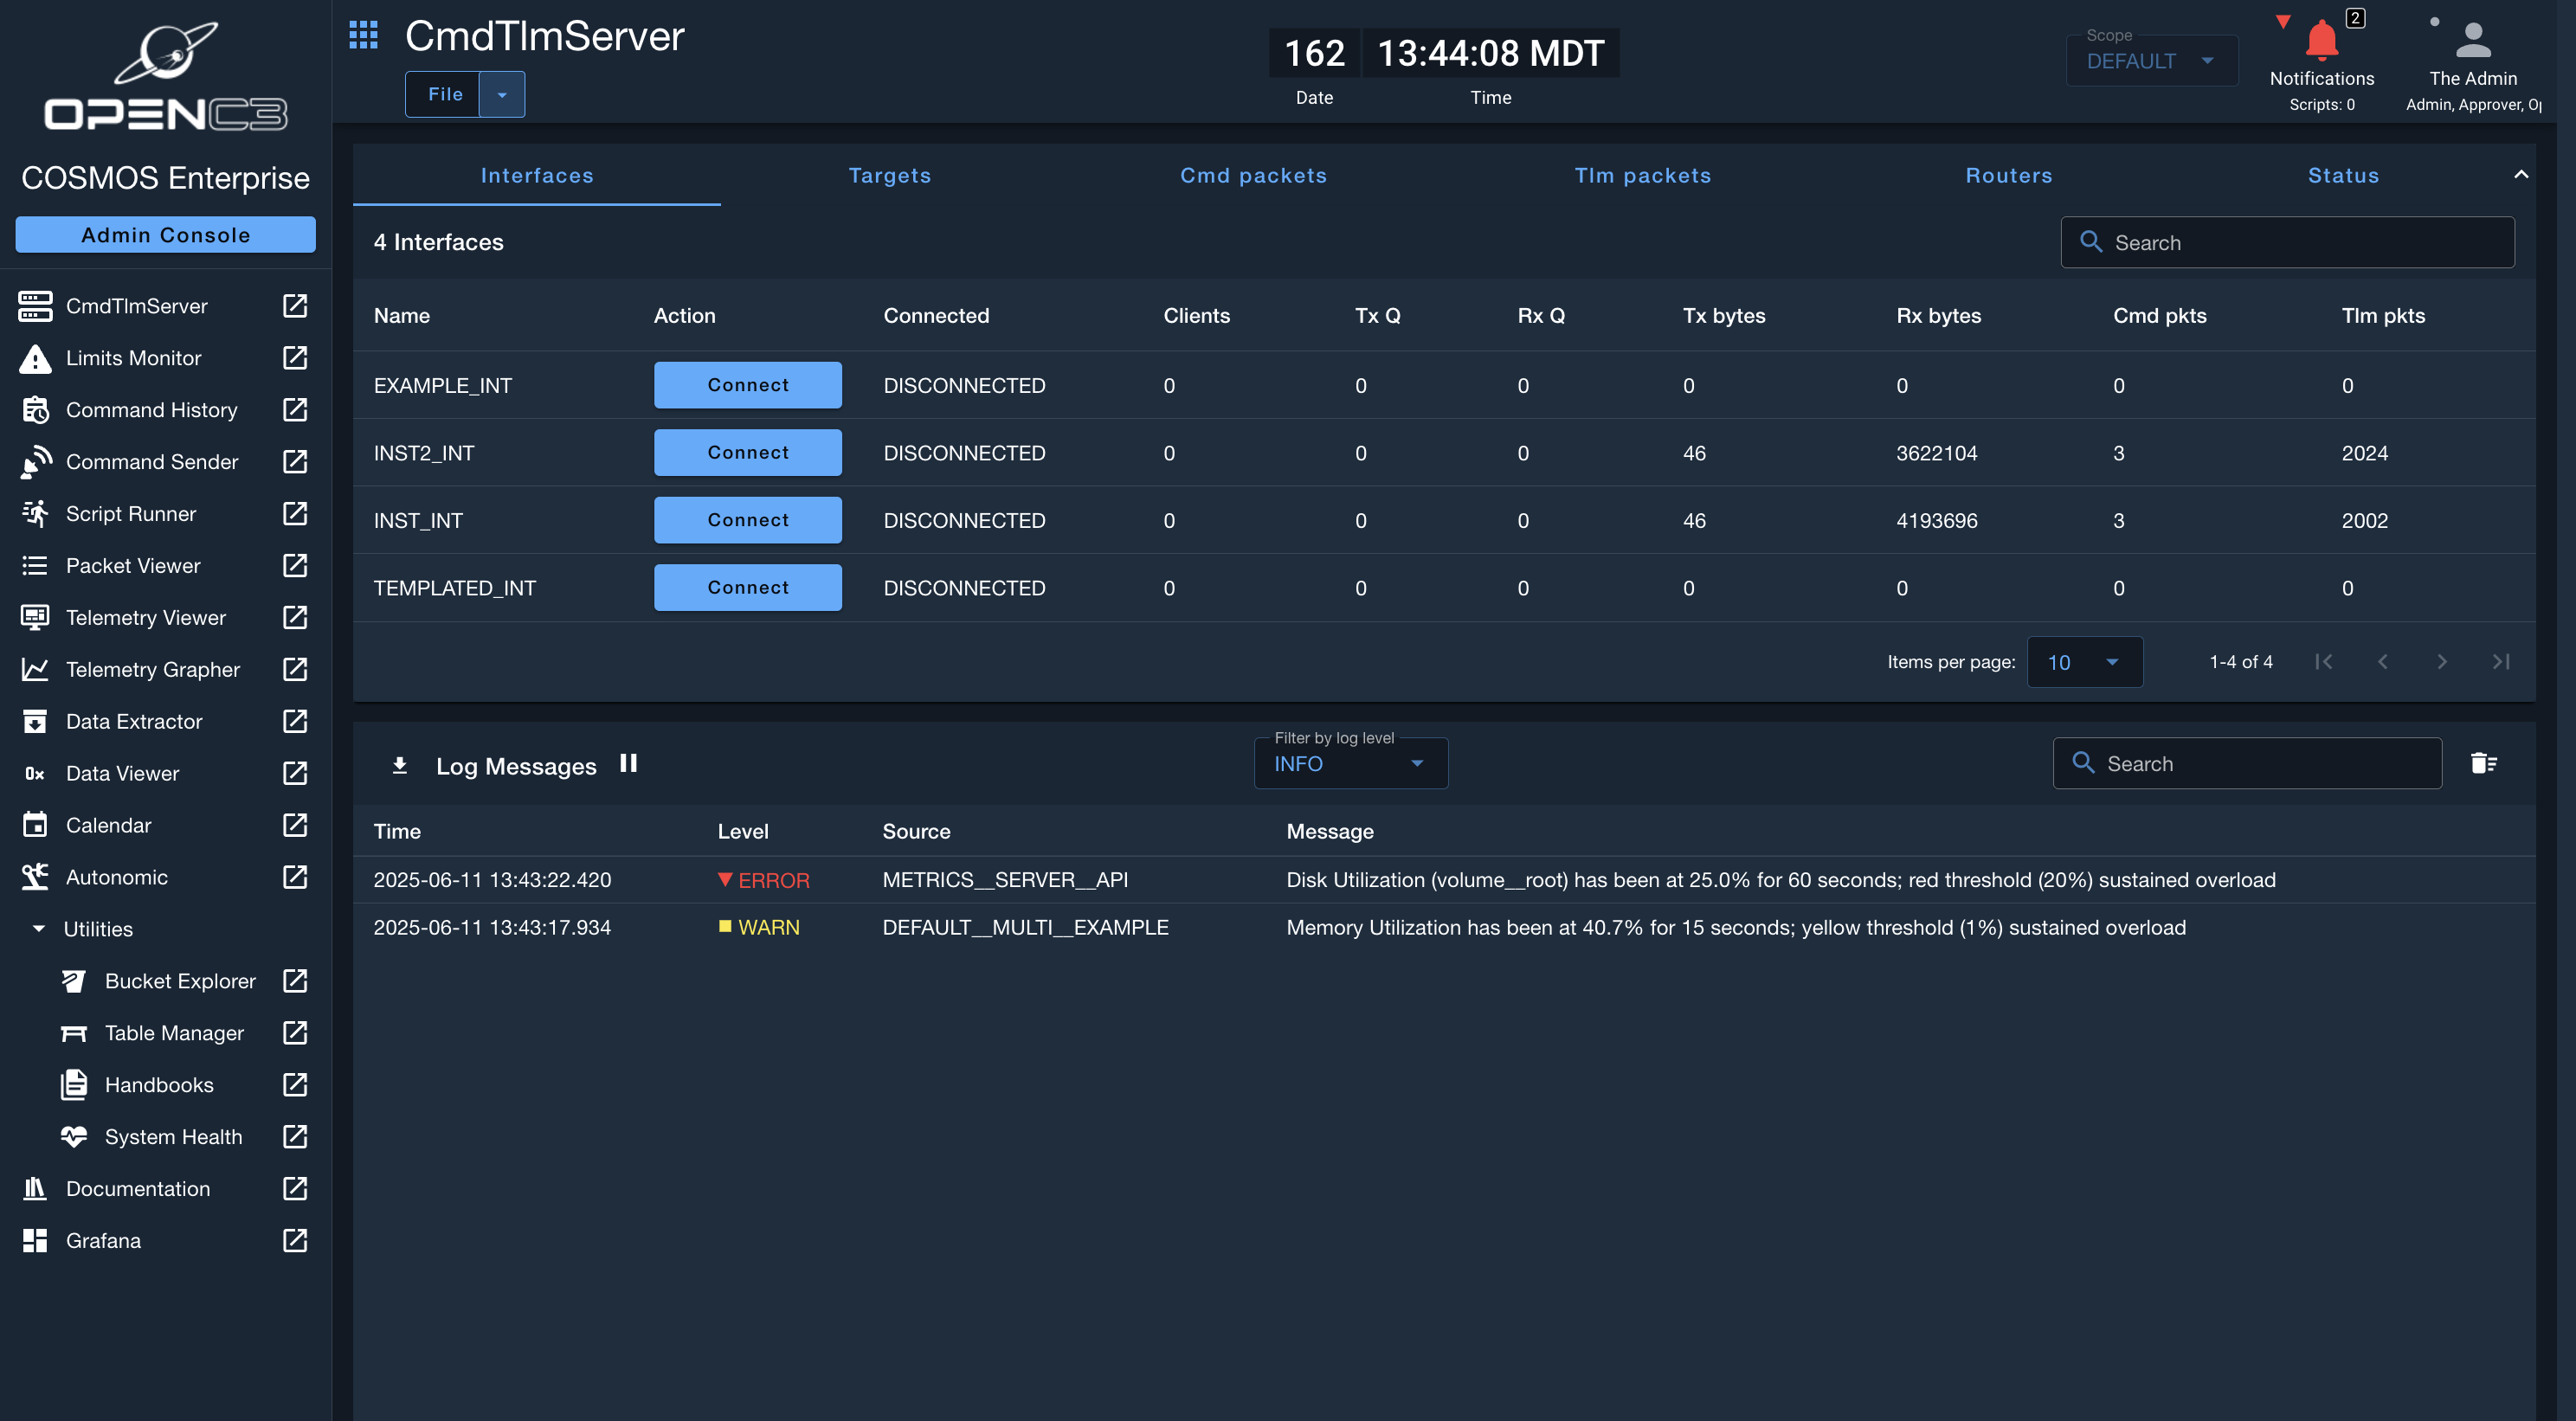
If thresholds are met, users will see the log message indicating the system health issues, as well as be notified through the notification bell.
Logs are displayed if System Health thresholds are met.
The notification bell will also contain the notifications if System Health thresholds are met.