Dashboards
Dashboards is in beta. Panels, the editor and the dashboard file format can change in any release without notice, and dashboards made now may need updating. Every saved dashboard file starts with a comment saying so, and the tool shows the same notice at the top of the page.
Introduction
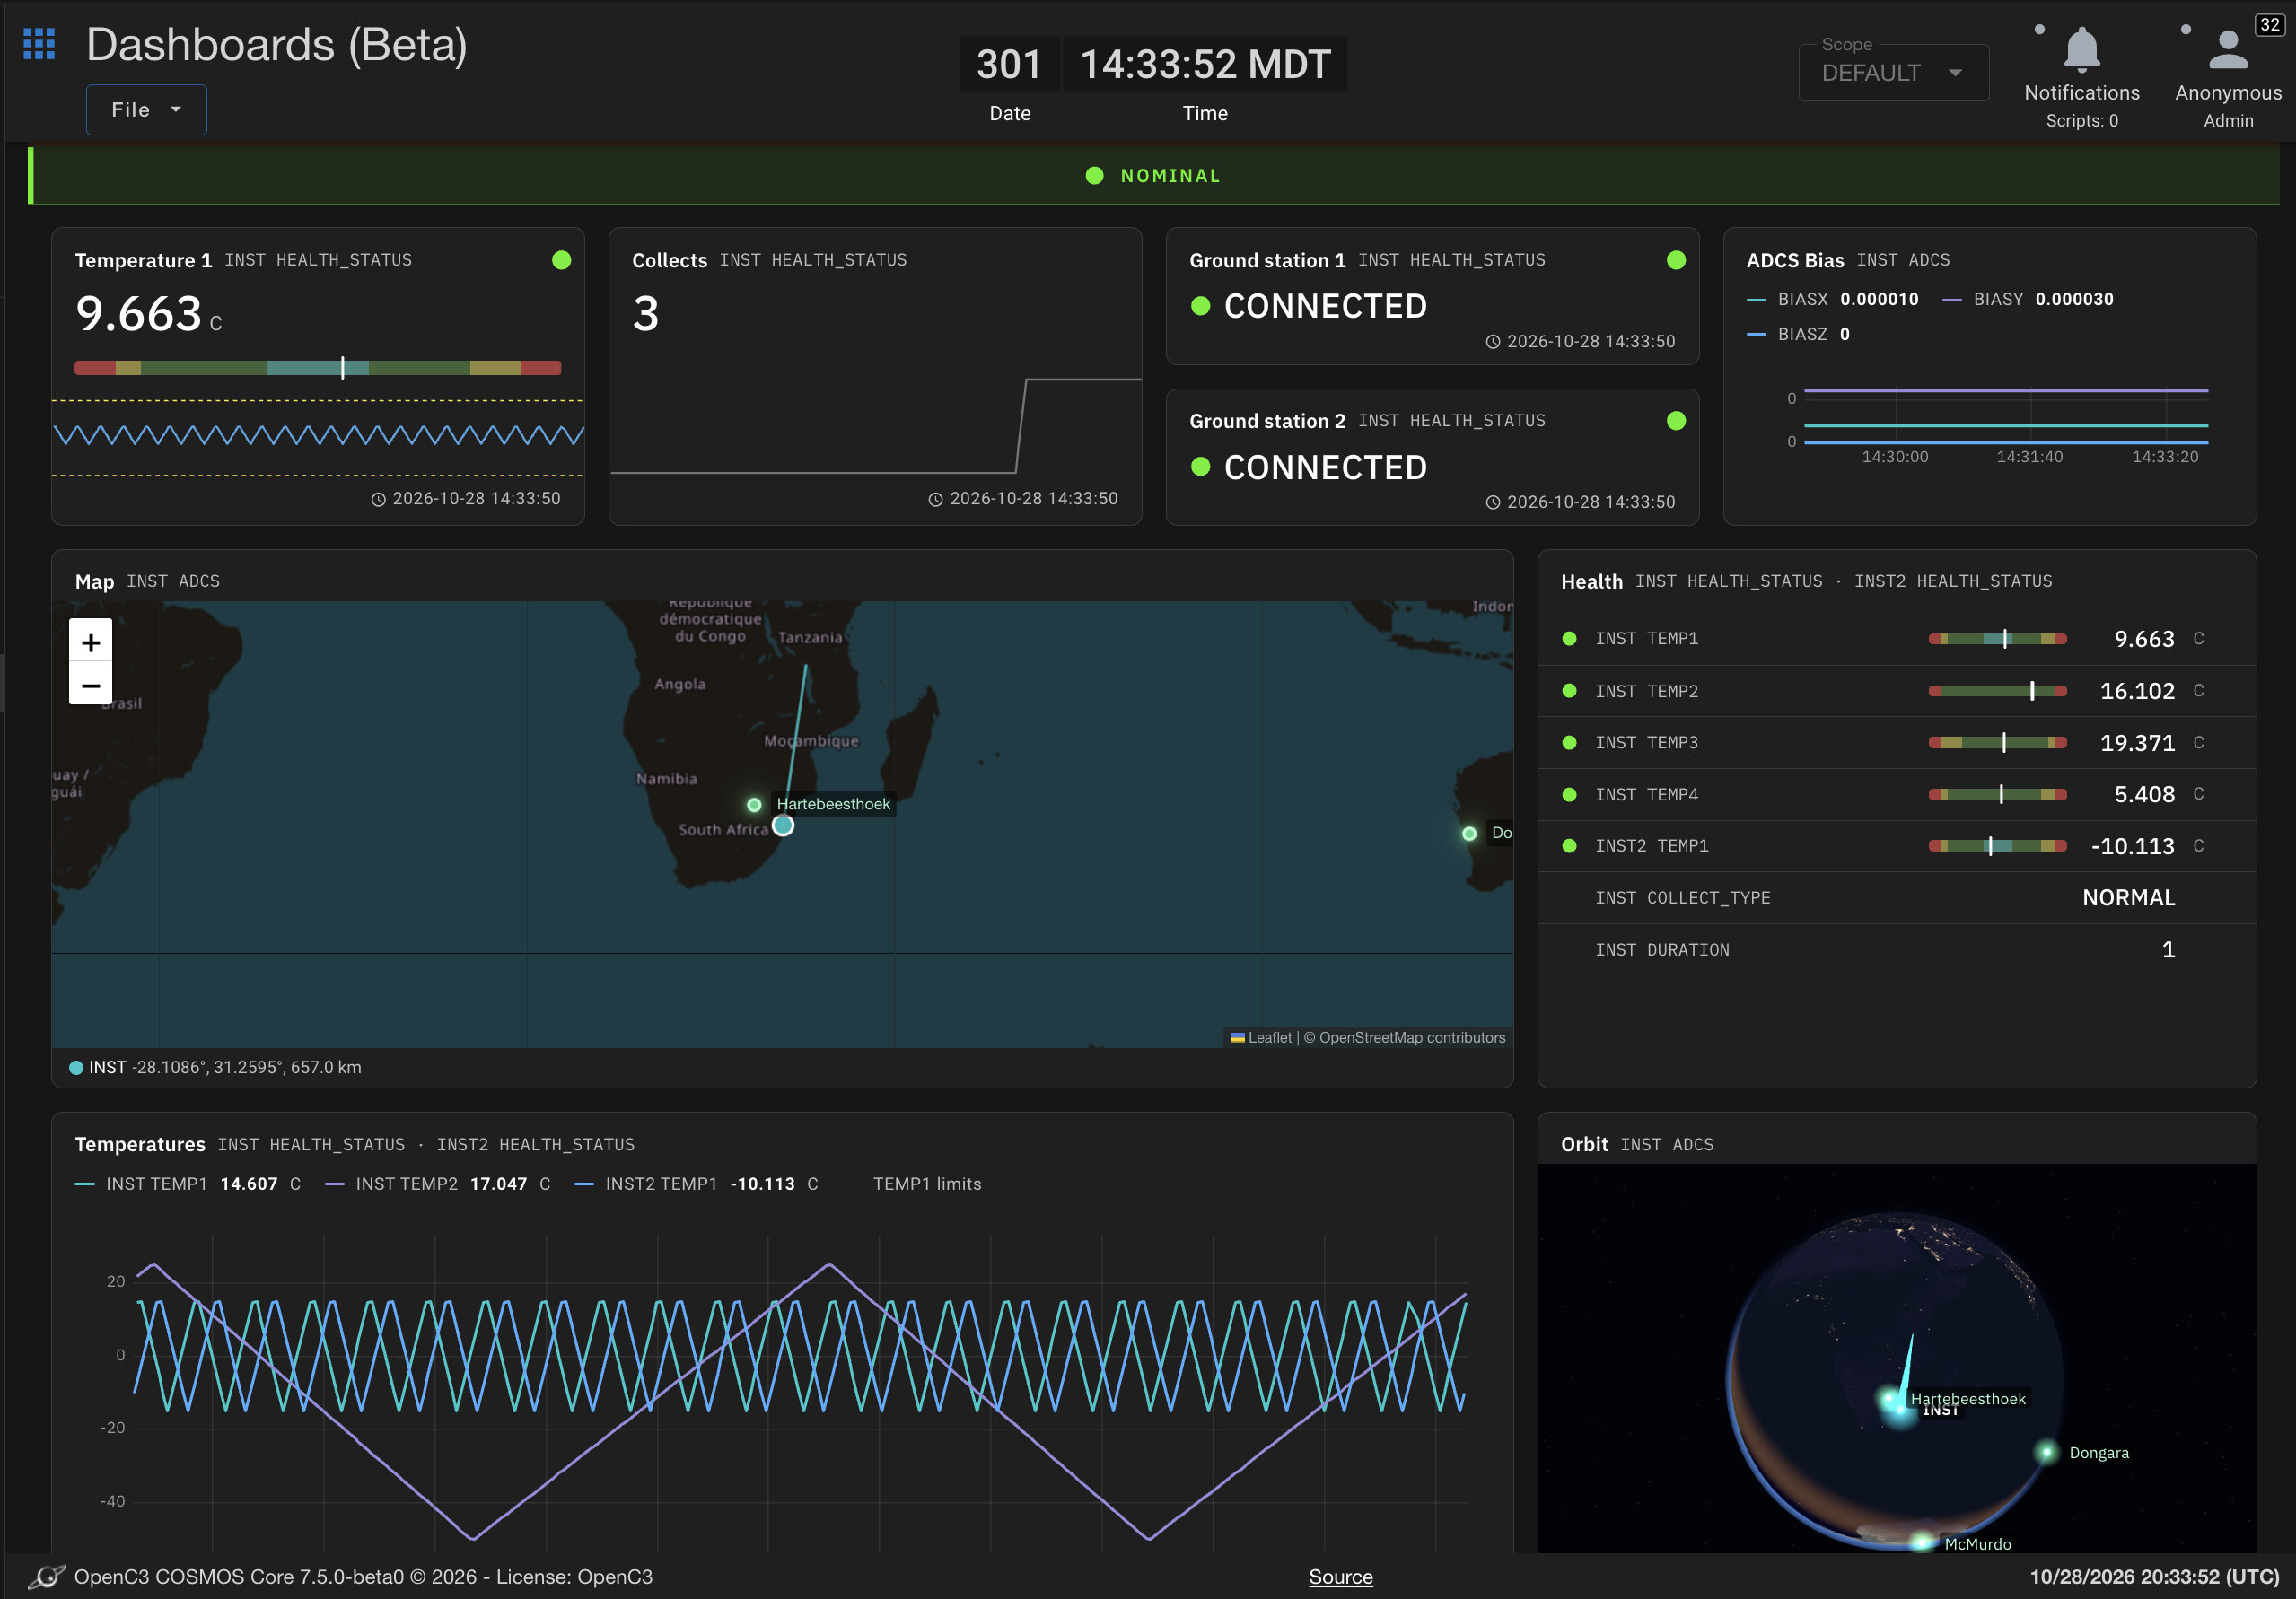
Dashboards puts the telemetry, limits and commands you care about on one page. A dashboard is a grid of panels: big single values with sparklines, gauges, states, graphs, tables of values, the items out of limits, command buttons and even existing Telemetry Viewer screens. The whole dashboard rolls up into one health banner, so you can see at a glance whether everything is nominal.
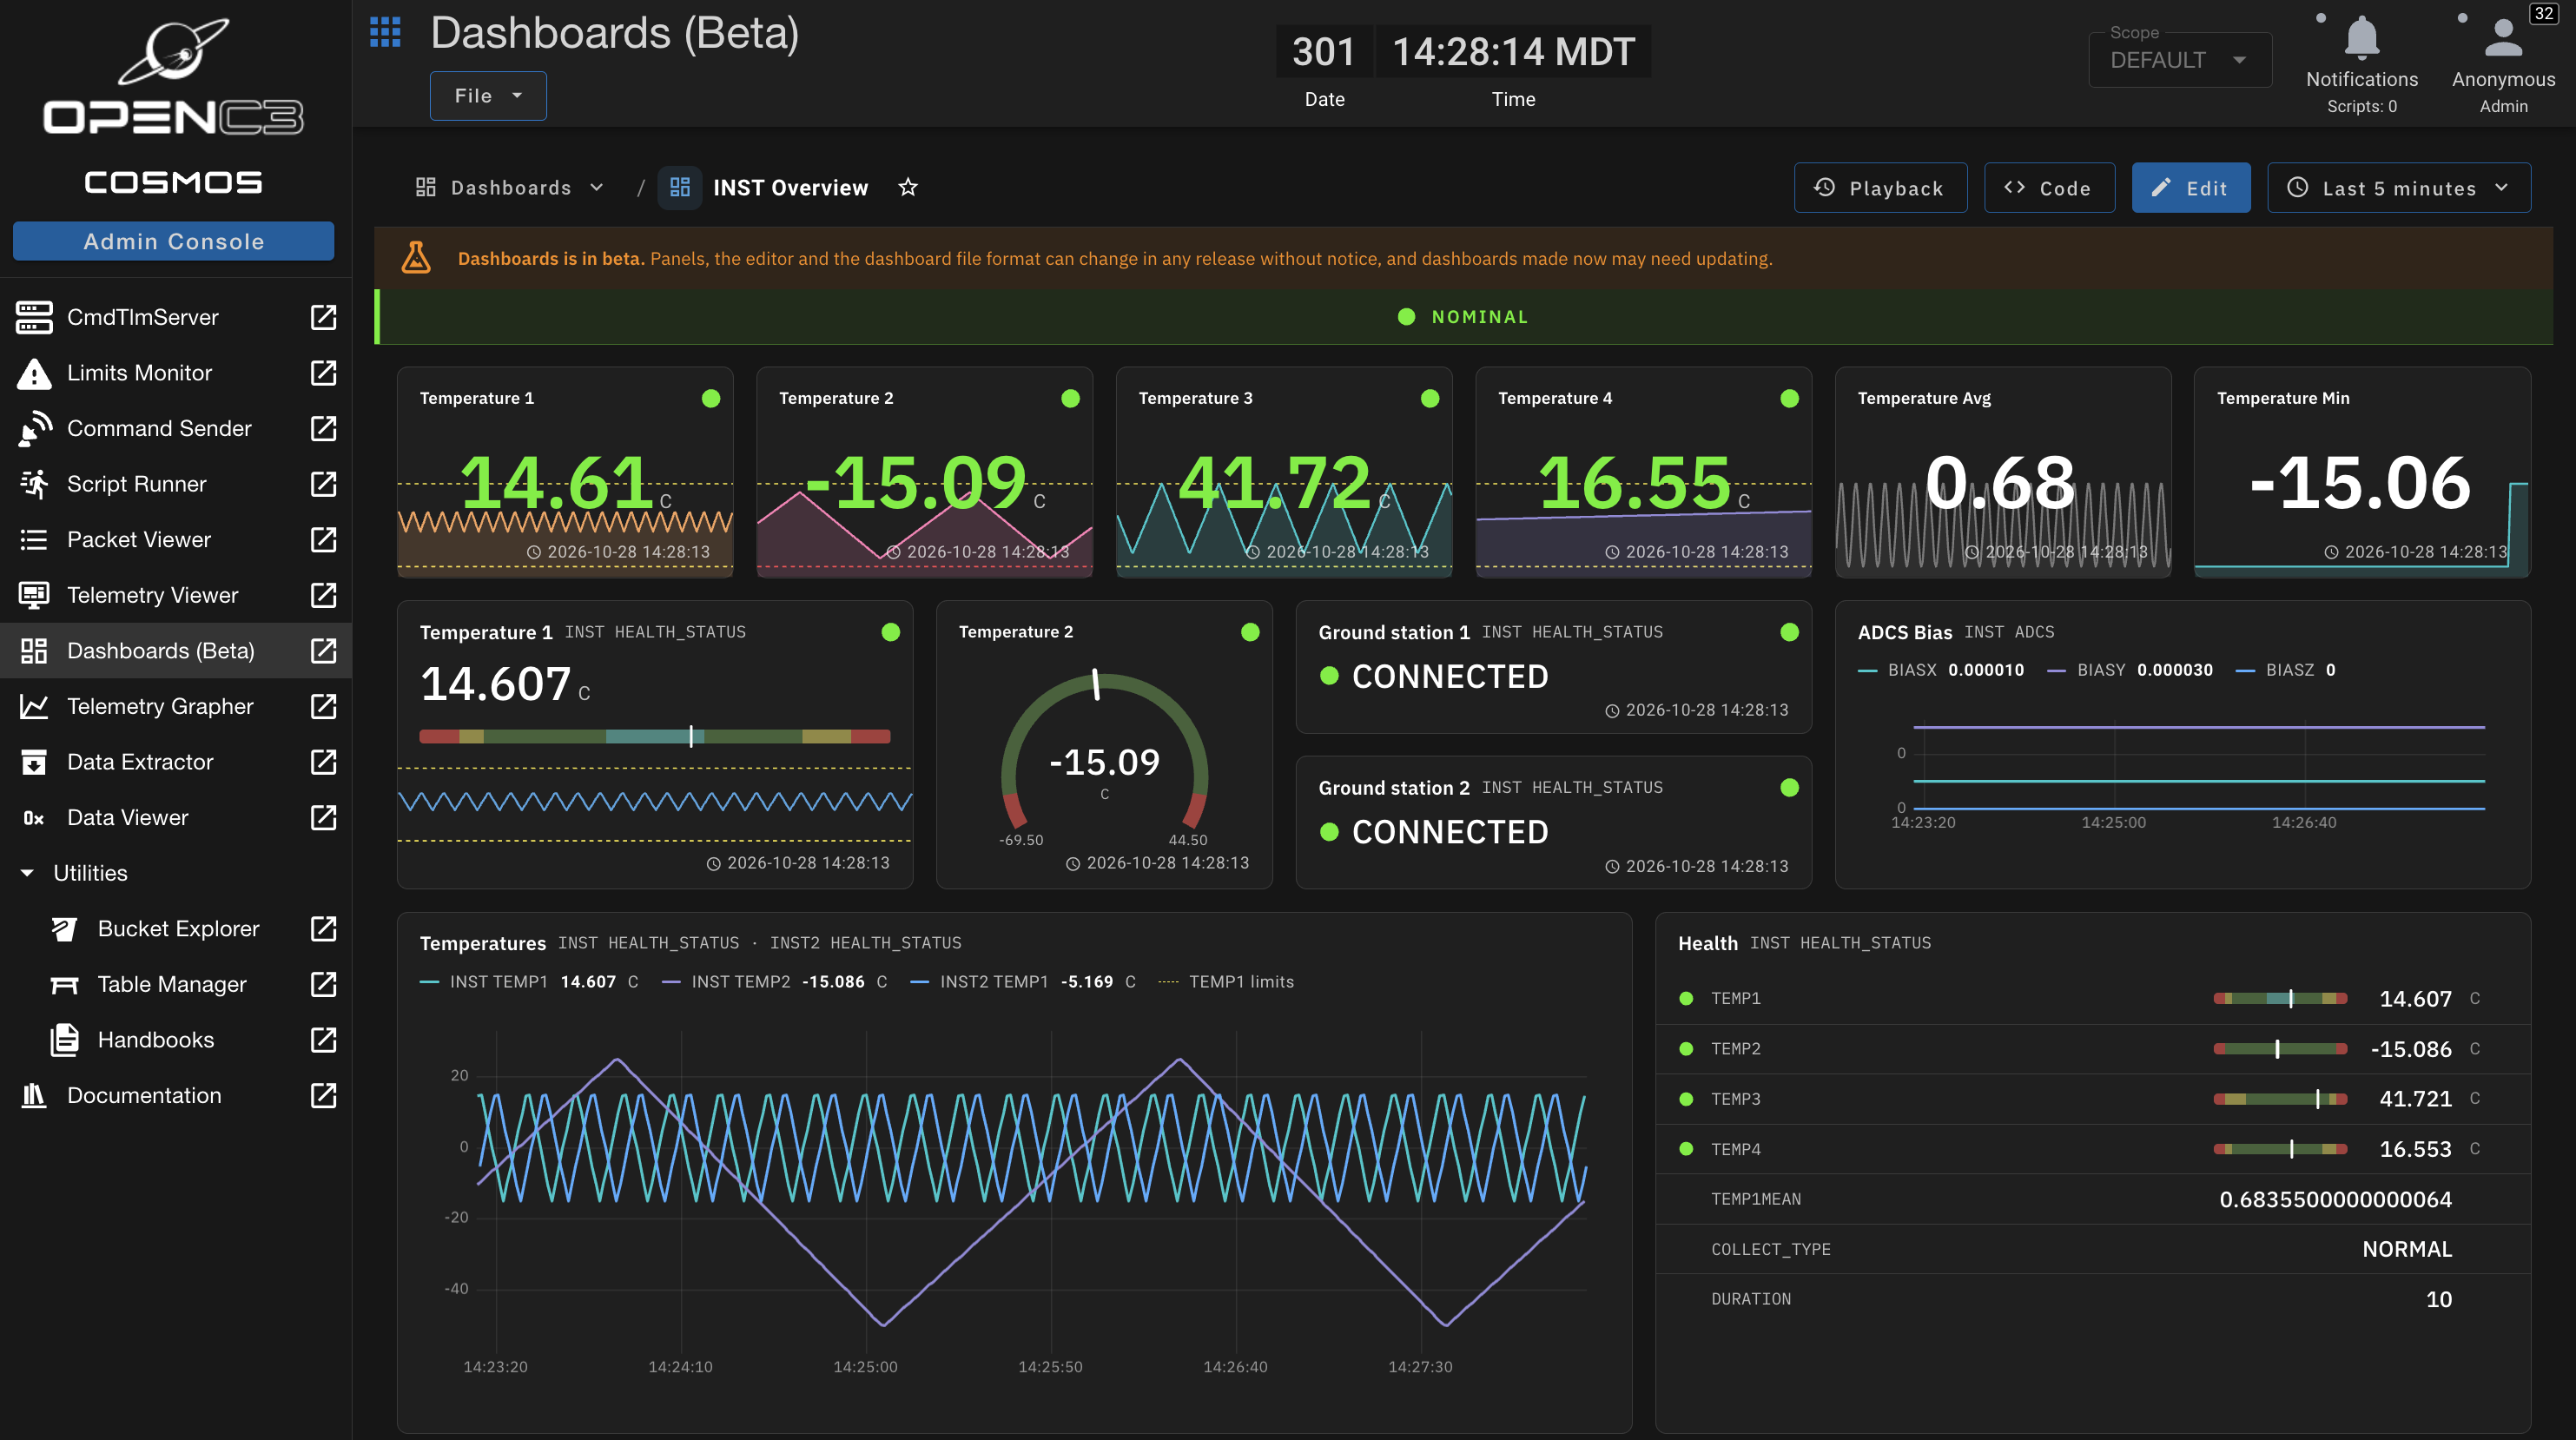
Each dashboard is a plain text file saved in a target, so dashboards can be shipped in plugins, versioned and edited by hand, the same way as telemetry screens.
Selecting a Dashboard
Click Dashboards in the header (or press Ctrl+K, ⌘K on a Mac) to open the dashboard selector.
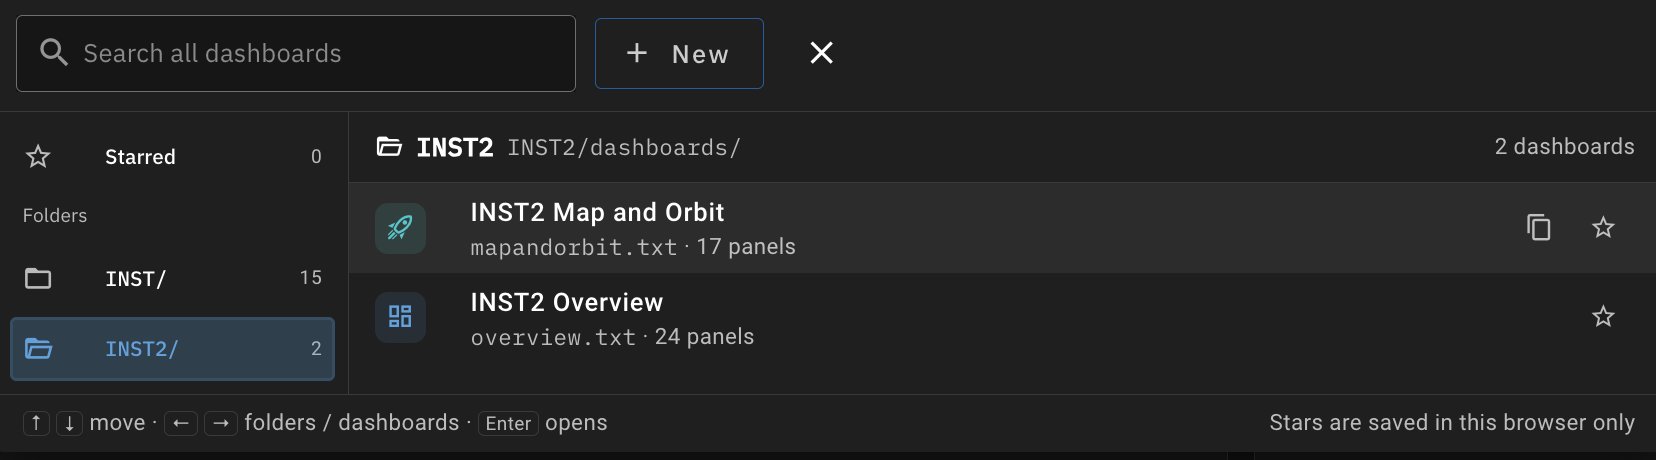
- Starred lists the dashboards you've starred. Star a dashboard with the star next to its name in the header or in the list. Stars are saved in your browser only.
- Folders has one folder per target. Each dashboard is saved in a target, as
TARGET/dashboards/NAME.txt. - Search covers every folder by name and title; pick a folder to narrow the results.
- Each row shows the dashboard's icon, title, file and number of panels. The dashboard you have open is tagged Open. Use the copy icon to duplicate a dashboard into another target or name.
- New creates an empty dashboard.
The selector works from the keyboard: ↑ ↓ move through the folders, → or Enter opens a folder, then ↑ ↓ move through its dashboards and Enter opens one. ← goes back to the folders.
Dashboards remembers the last dashboard you opened and opens it the next time. The URL names the open dashboard (/tools/dashboards/TARGET/NAME), so you can bookmark or share a link to it.
File Menu
- New Dashboard creates an empty dashboard in a target you choose
- Version History shows earlier saved versions of the dashboard and restores one (Enterprise)
- Delete Dashboard deletes the open dashboard
Viewing a Dashboard
- Health banner: the worst status of any panel. Nominal when everything is within limits, Caution or Critical with the number of panels affected and a button that scrolls to the worst one, or Stale when telemetry stops arriving. Each panel's border also takes its status color.
- Item details: click a value to see it larger with its raw value, packet time, description and limits.
- Off screen problems: when a panel out of limits is scrolled out of view, a colored bar at the top or bottom of the grid points to it; click it to scroll there.
Changing the Time Range
Graphs and sparklines show the last few minutes of history, backfilled when the dashboard opens and then updated live. Pick how much from the time range menu in the header: one of the quick ranges or a custom range from 30 seconds up to 24 hours. Your choice is remembered in this browser and applies to every dashboard.
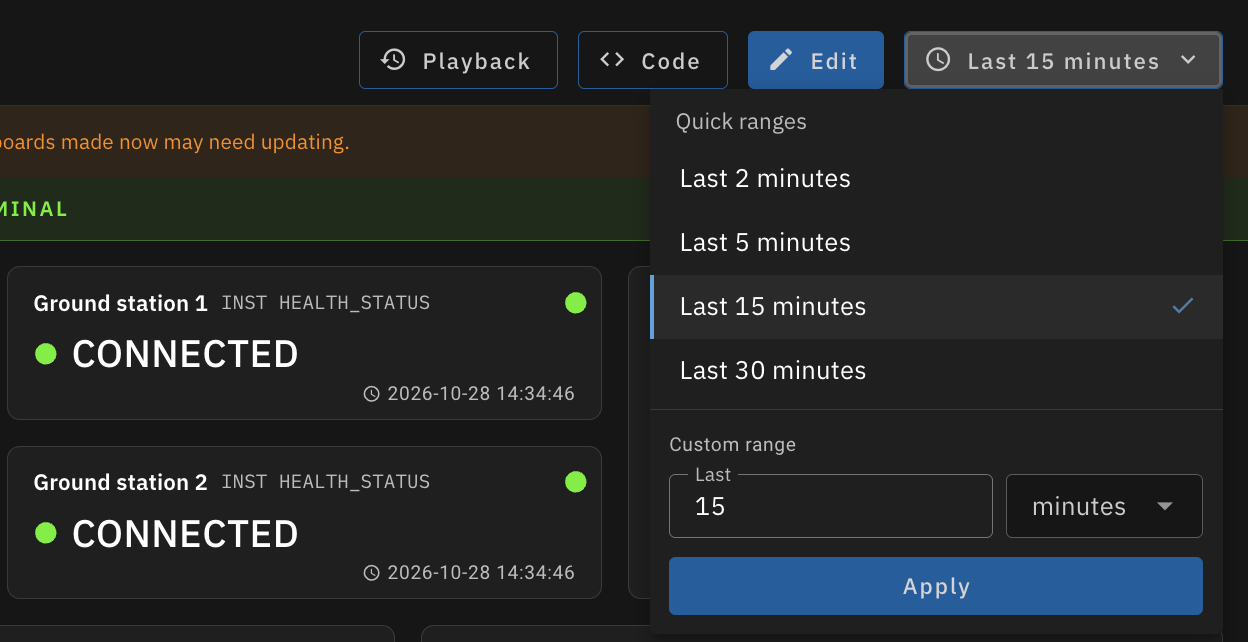
Hover over any graph or sparkline to see the values at that time. The time is shared, so every graph and sparkline on the dashboard marks the same moment.
Playback
Click Playback to look at the dashboard as it was at an earlier time, using the same playback controls as Telemetry Viewer. Pick a date and time, then play, pause, step or skip. Every panel shows the telemetry as of the playback time, graphs show the time range leading up to it, and commands are disabled. Click Playback again to go back to live telemetry.
Building a Dashboard
Click Edit to change the open dashboard. While editing, telemetry keeps updating but panels don't send commands or run scripts.
- Add panel opens the panel dialog
- Drag a panel's header to move it and its bottom right corner to resize it. Panels never overlap: others move out of the way.
- Use the buttons in a panel's header to Configure, Duplicate or Delete it
- With a panel focused, the arrow keys move it and Shift+arrows resize it
- Undo and Redo (Ctrl+Z, Ctrl+Shift+Z) step through your changes
- Click the dashboard's icon to pick its icon and color, and edit its title next to it
- Save writes the dashboard; Cancel goes back to the saved version
The Panel Dialog
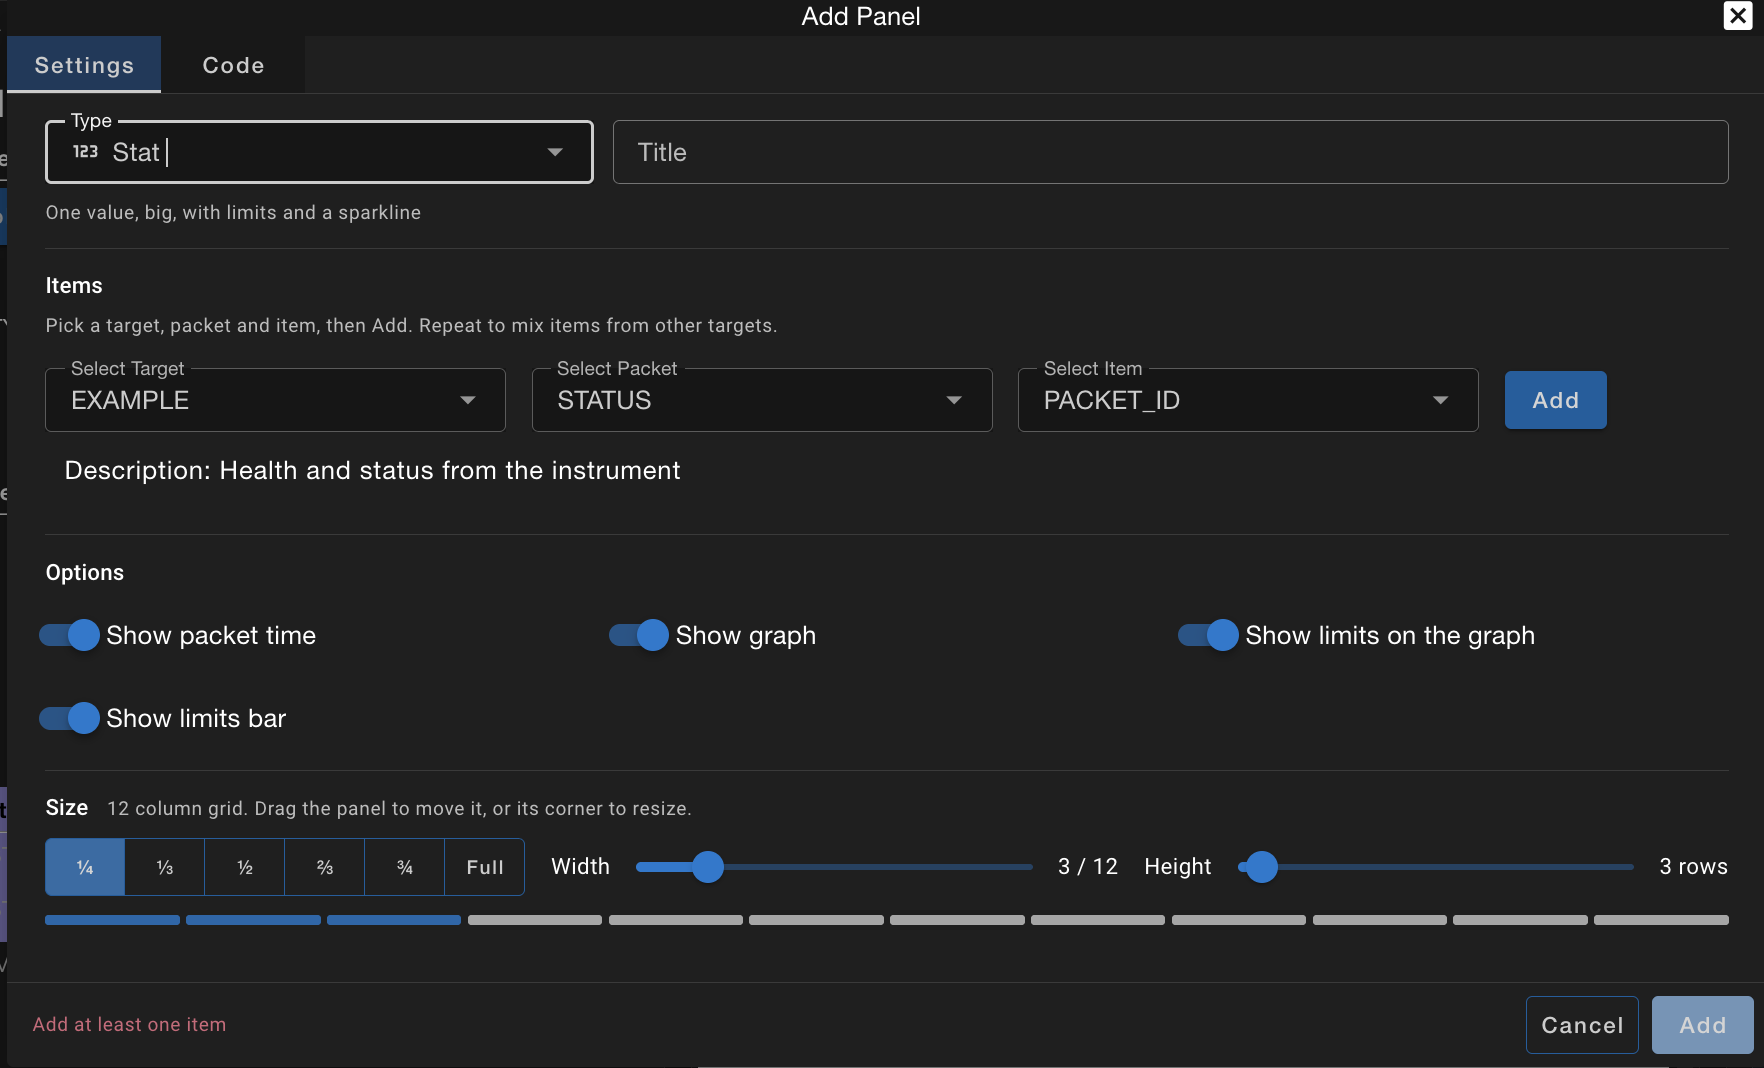
Pick the panel Type and an optional Title, then fill in what the panel shows: telemetry items for most panels, targets for Limits, a command or script for Command, a screen for Screen. Items can come from any target. The Options below change with the panel type, and Size sets the panel's width (quick buttons for ¼ to full width) and height in rows. The Code tab shows the panel as text.
12 and 24 Column Grids
Dashboards are laid out on a grid of 12 columns, which fits most screens. Choose 24 columns when you create a dashboard for big monitors and ultra wide screens, where 12 columns makes panels too wide. Rows have a fixed height.
You lay a dashboard out once, for the desktop. On narrower screens it rearranges itself and nothing extra is saved:
- Tablet (1000 pixels wide or less): panels a third of the grid wide or narrower take half the width, the rest go full width
- Phone (600 pixels wide or less): every panel takes the full width, side by side panels reading left column first
Single value panels adapt to their size too. For example, a Stat panel only two columns wide shortens its value (12.35k, 1.23M) and drops its target and packet from the header, and a short Stat panel draws its graph behind the value.
Panels
| Panel | Shows | Options |
|---|---|---|
| Stat | One value, big, with a limits bar and a sparkline over the time range | Show packet time, graph, limits on the graph and limits bar; line color |
| Gauge | One value on a dial with its limits as colored zones | Show packet time; item limits or custom red / yellow limits; scale minimum and maximum |
| State | The current state of an item, such as CONNECTED, with its status color | Show packet time |
| Graph | Up to 6 items over the time range, with limits drawn as bands and dashed lines | Which item's limits to draw; line colors |
| Values | A table of items with their status, limits bars and units | Show limits bars |
| Limits | The items currently out of limits for the chosen targets, worst first, and how long they've been out | |
| Screen | An existing Telemetry Viewer screen; edit the screen right in the panel dialog | |
| Command | A command with preset parameters, or a button that runs a script. Critical commands go through the usual approval. | Hold or click to send; parameters to hide; details text; open Script Runner when a script starts |
Items are shown as their converted values by default. Pick RAW, FORMATTED or WITH_UNITS per item in the panel dialog.
The Dashboard File
Click Code to see the dashboard as text. You can edit it there, and problems are reported with their line numbers. The same text is what's saved to TARGET/dashboards/NAME.txt, so dashboards can also be written by hand and shipped in a plugin's targets like screens are.
# Dashboards is a beta feature: this file format can change in any release
DASHBOARD "INST Overview"
  COLUMNS 24
  SETTING ICON mdi-satellite-variant
  SETTING COLOR "#00c7cb"
  SETTING POLLING_PERIOD 1

PANEL STAT 0 0 3 4 "Temperature 1"
  ITEM INST HEALTH_STATUS TEMP1
    ITEM_SETTING COLOR "#f6a25b"
  SETTING PACKET_TIME FALSE
END

PANEL GRAPH 3 0 9 7 "Temperatures"
  ITEM INST HEALTH_STATUS TEMP1
  ITEM INST HEALTH_STATUS TEMP2
  SETTING THRESHOLDS INST HEALTH_STATUS TEMP1
END

PANEL LIMITS 0 7 4 6 "Limits"
  TARGET INST
  TARGET INST2
END

PANEL COMMAND 4 7 4 6 "Collect"
  COMMAND INST COLLECT
  PARAMETER TYPE NORMAL
  PARAMETER DURATION 1
  SETTING CONFIRM HOLD
END

PANEL SCREEN 8 7 4 13
  SCREEN INST HS
END
| Keyword | Usage |
|---|---|
DASHBOARD | DASHBOARD <Title>: first line of the file |
COLUMNS | COLUMNS <12 or 24>: the grid, before the first panel. 12 when left out. |
SETTING | SETTING <Name> [Values...]: after DASHBOARD, a dashboard setting (ICON, COLOR, POLLING_PERIOD in seconds); inside a panel, one of the panel's options |
PANEL | PANEL <Type> <Column> <Row> <Width> <Height> [Title]: starts a panel. Column and row start at 0; width is in columns and height in rows. |
ITEM | ITEM <Target> <Packet> <Item> [Value Type]: a telemetry item |
ITEM_SETTING | ITEM_SETTING <Name> [Values...]: an option for the ITEM above it, such as COLOR |
TARGET | TARGET <Target>: a target for a Limits panel |
COMMAND | COMMAND <Target> <Command>: the command a Command panel sends |
PARAMETER | PARAMETER <Parameter> <Value>: a preset command parameter |
SCRIPT | SCRIPT <Script>: the script a Command panel runs, e.g. INST/procedures/collect.rb |
SCREEN | SCREEN <Target> <Screen>: the screen a Screen panel shows |
END | Ends a panel |
Settings are only written when they differ from their defaults.
In Telemetry Viewer, File > Convert to Dashboard saves the open screens as a new dashboard, one Screen panel per screen, ready to rearrange and add to.
Custom Panels
Plugins can add their own panel types, such as the map and 3D orbit panels below. They appear under Plugins in the panel type picker and work like the built-in panels: they get the panel dialog, settings, polling, limits status, playback and the health banner.
A plugin declares each panel type in its plugin.txt and ships it as one JavaScript file, built with Vue.js:
PANEL BATTERY
The Panel Generator creates the scaffolding (cli generate panel BatteryPanel), and the Custom Panels guide covers the panel definition, settings and the panel SDK. If a dashboard uses a panel type whose plugin isn't installed, the panel says so and is kept as written, so the dashboard can be saved without losing it.