Command and Telemetry Server
Introduction
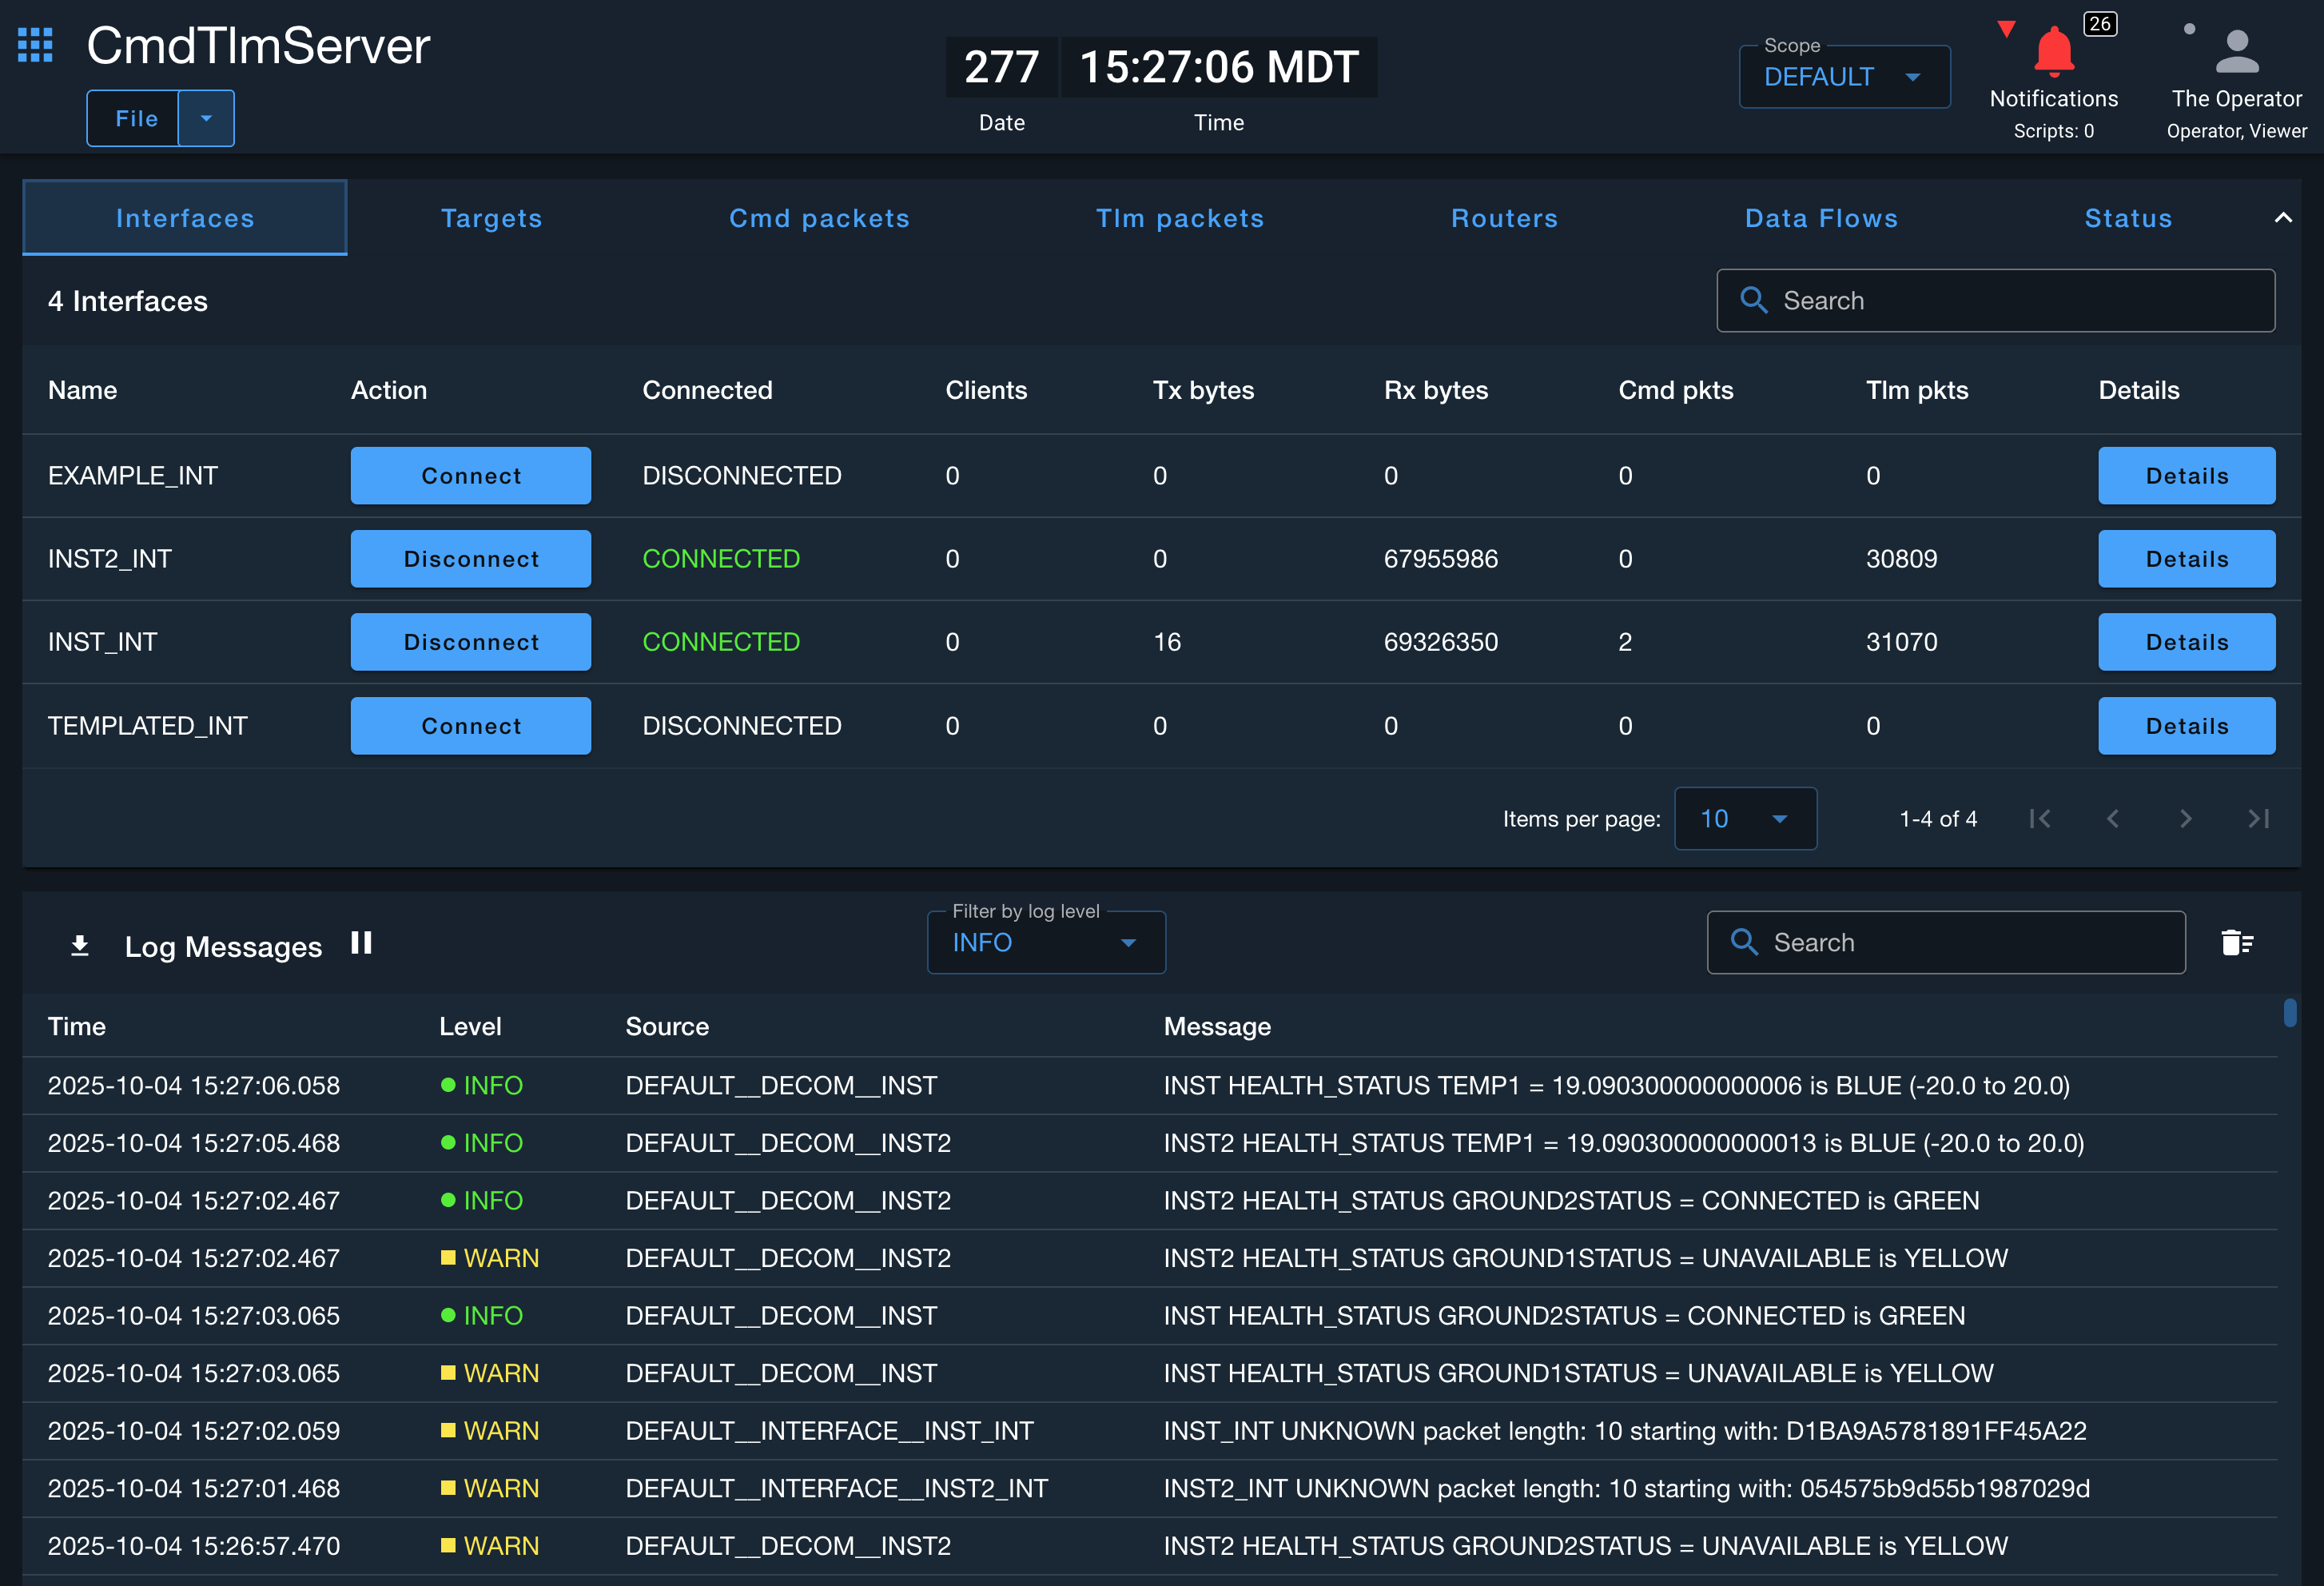
The Command and Telemetry Server application provides status about the interfaces and targets instantiated in your COSMOS installation. Interfaces can be connected or disconnected and raw byte counts are returned. The application also provides quick shortcuts to view both raw and formatted command and telemetry packets as they go through the COSMOS system. At the bottom of the Command and Telemetry Server is the Log Messages showing server messages.
Command and Telemetry Server Menus
File Menu Items
The Command and Telemetry Server has one menu under File -> Options:
This dialog changes the refresh rate of the Command and Telemetry Server to reduce load on both your browser window and the backend server. Note that this changes the refresh rate of the various tabs in the application. The Log Messages will continue to update as messages are generated.
Interfaces Tab
The Interfaces tab displays all the interfaces defined by your COSMOS installation. You can Connect or Disconnect interfaces and view raw byte and packet counts.

You can get additional details about the interface by clicking the details button.
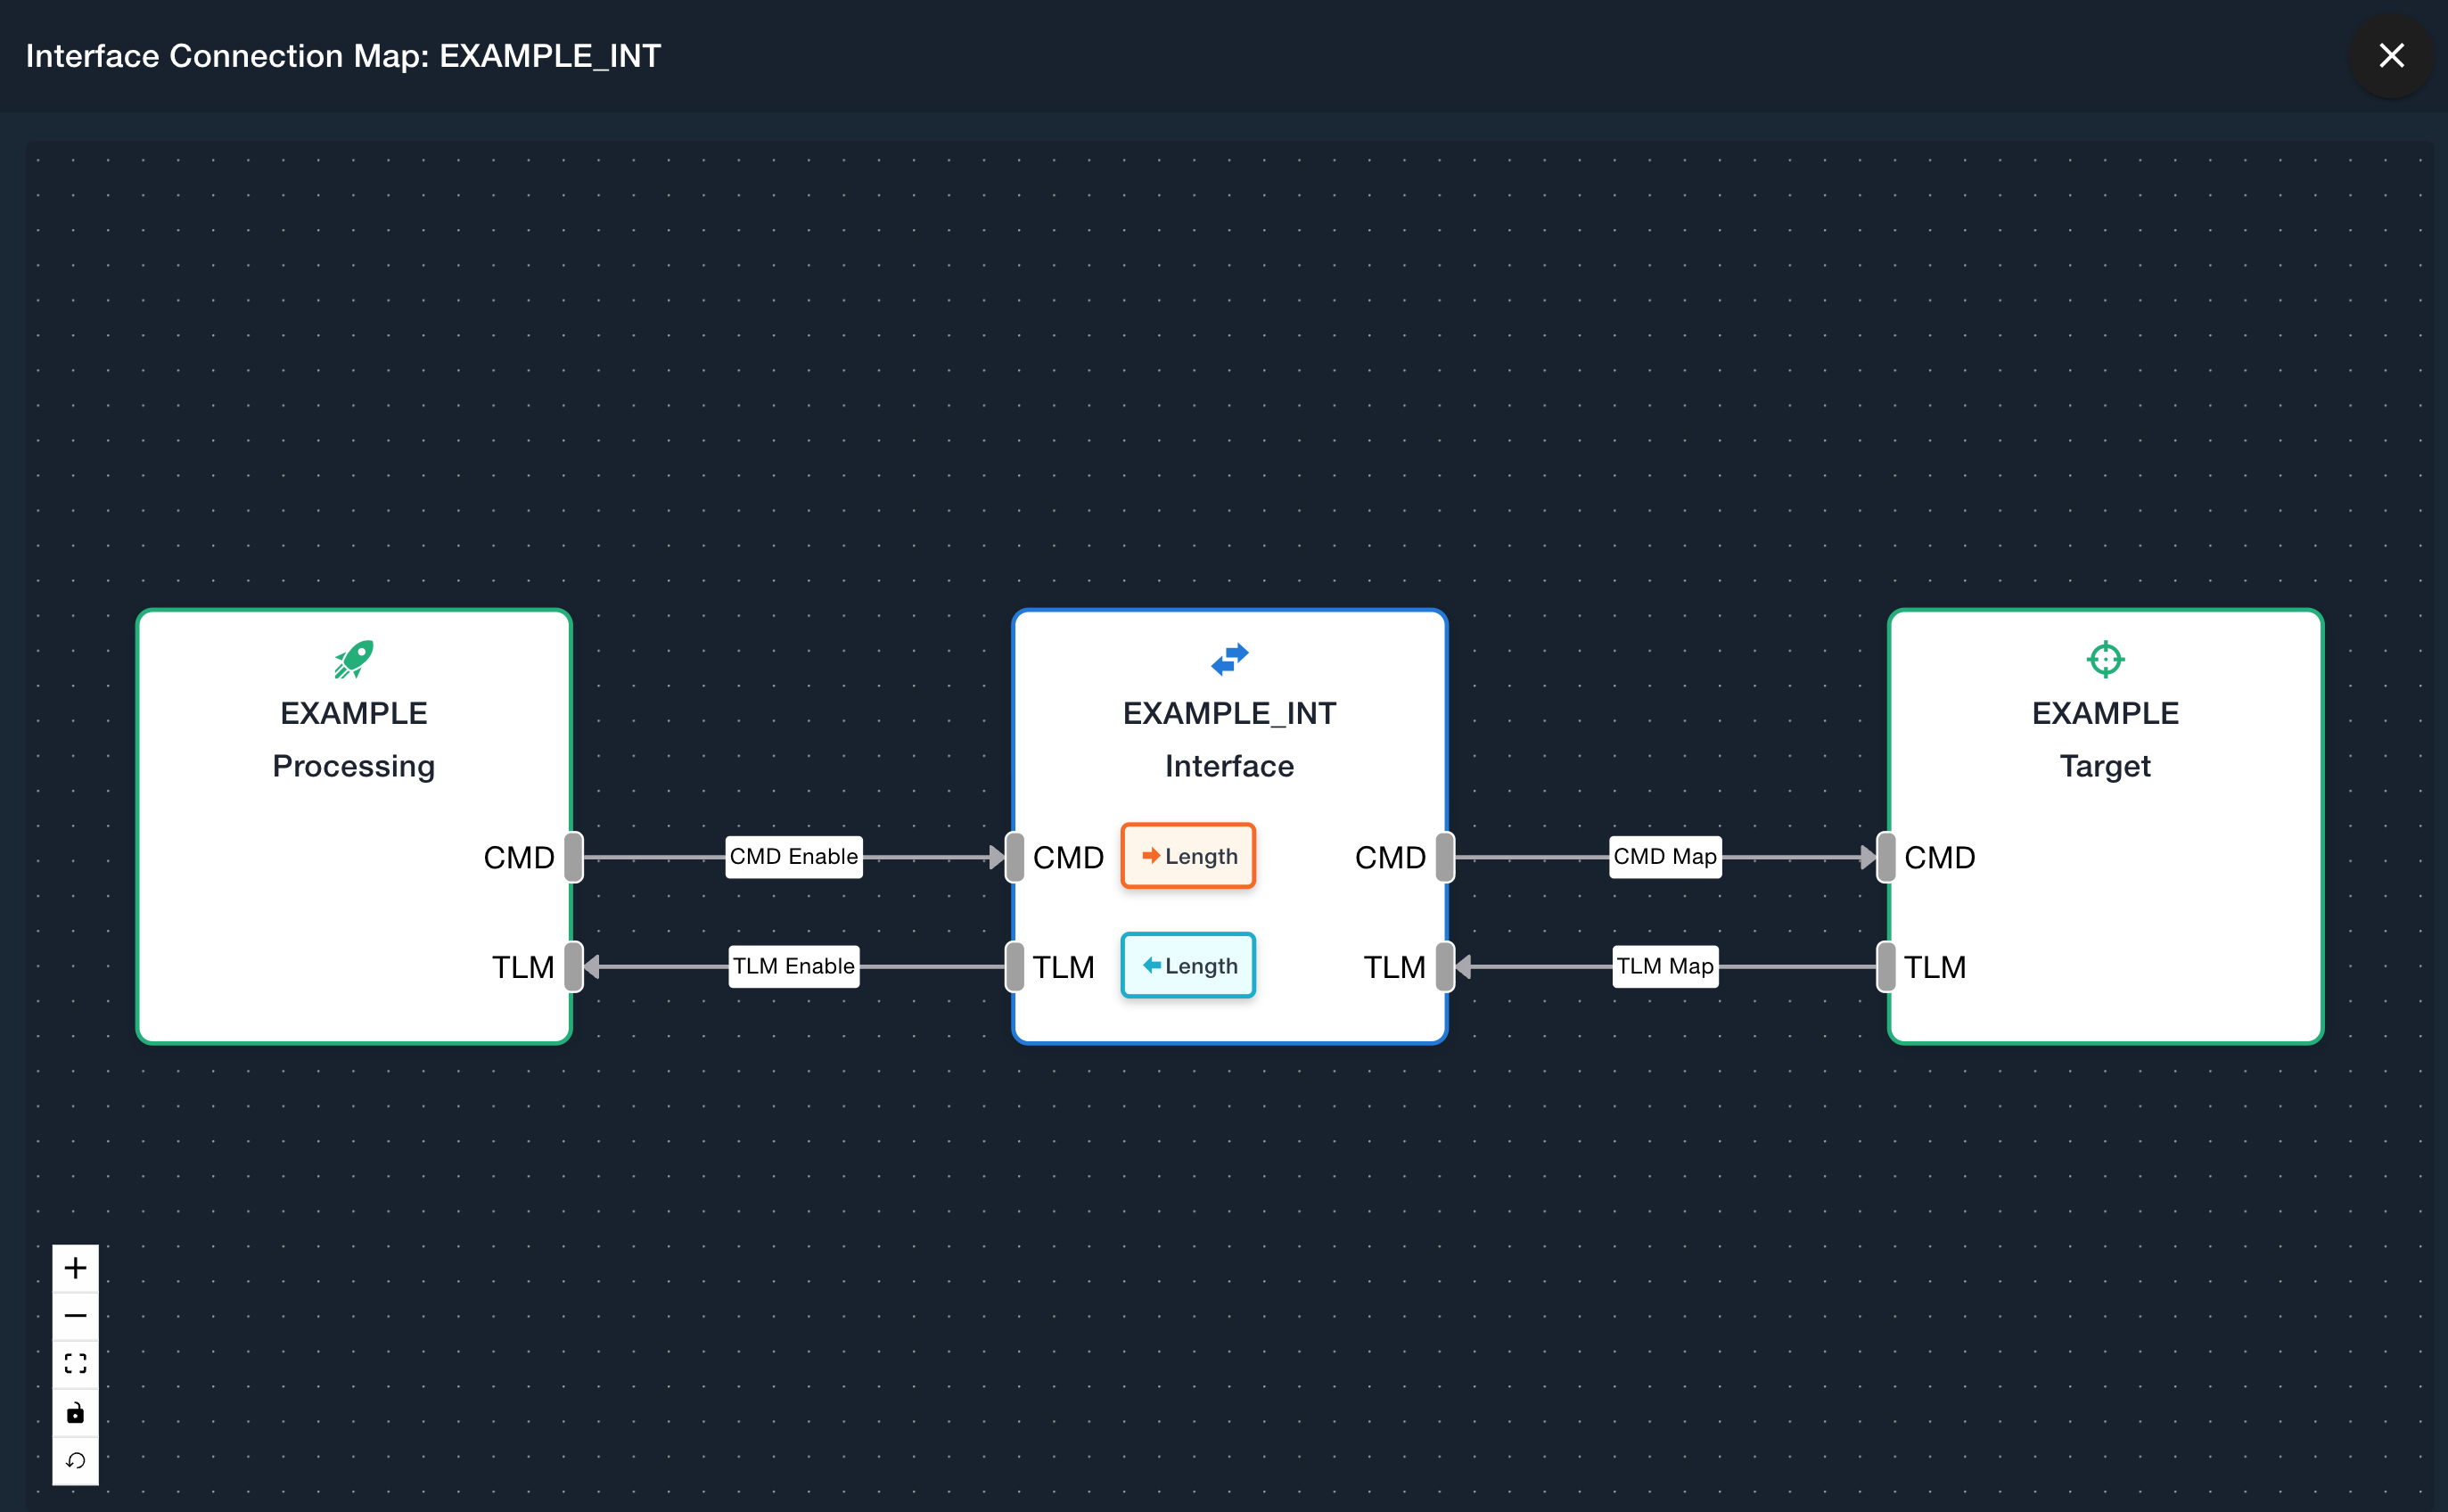
See the Data Flows tab for more details on how to interact with the interface data flows.
Targets Tab
The Targets tab displays all the targets and their mapped interfaces along with the Command Authority status (Enterprise Only).
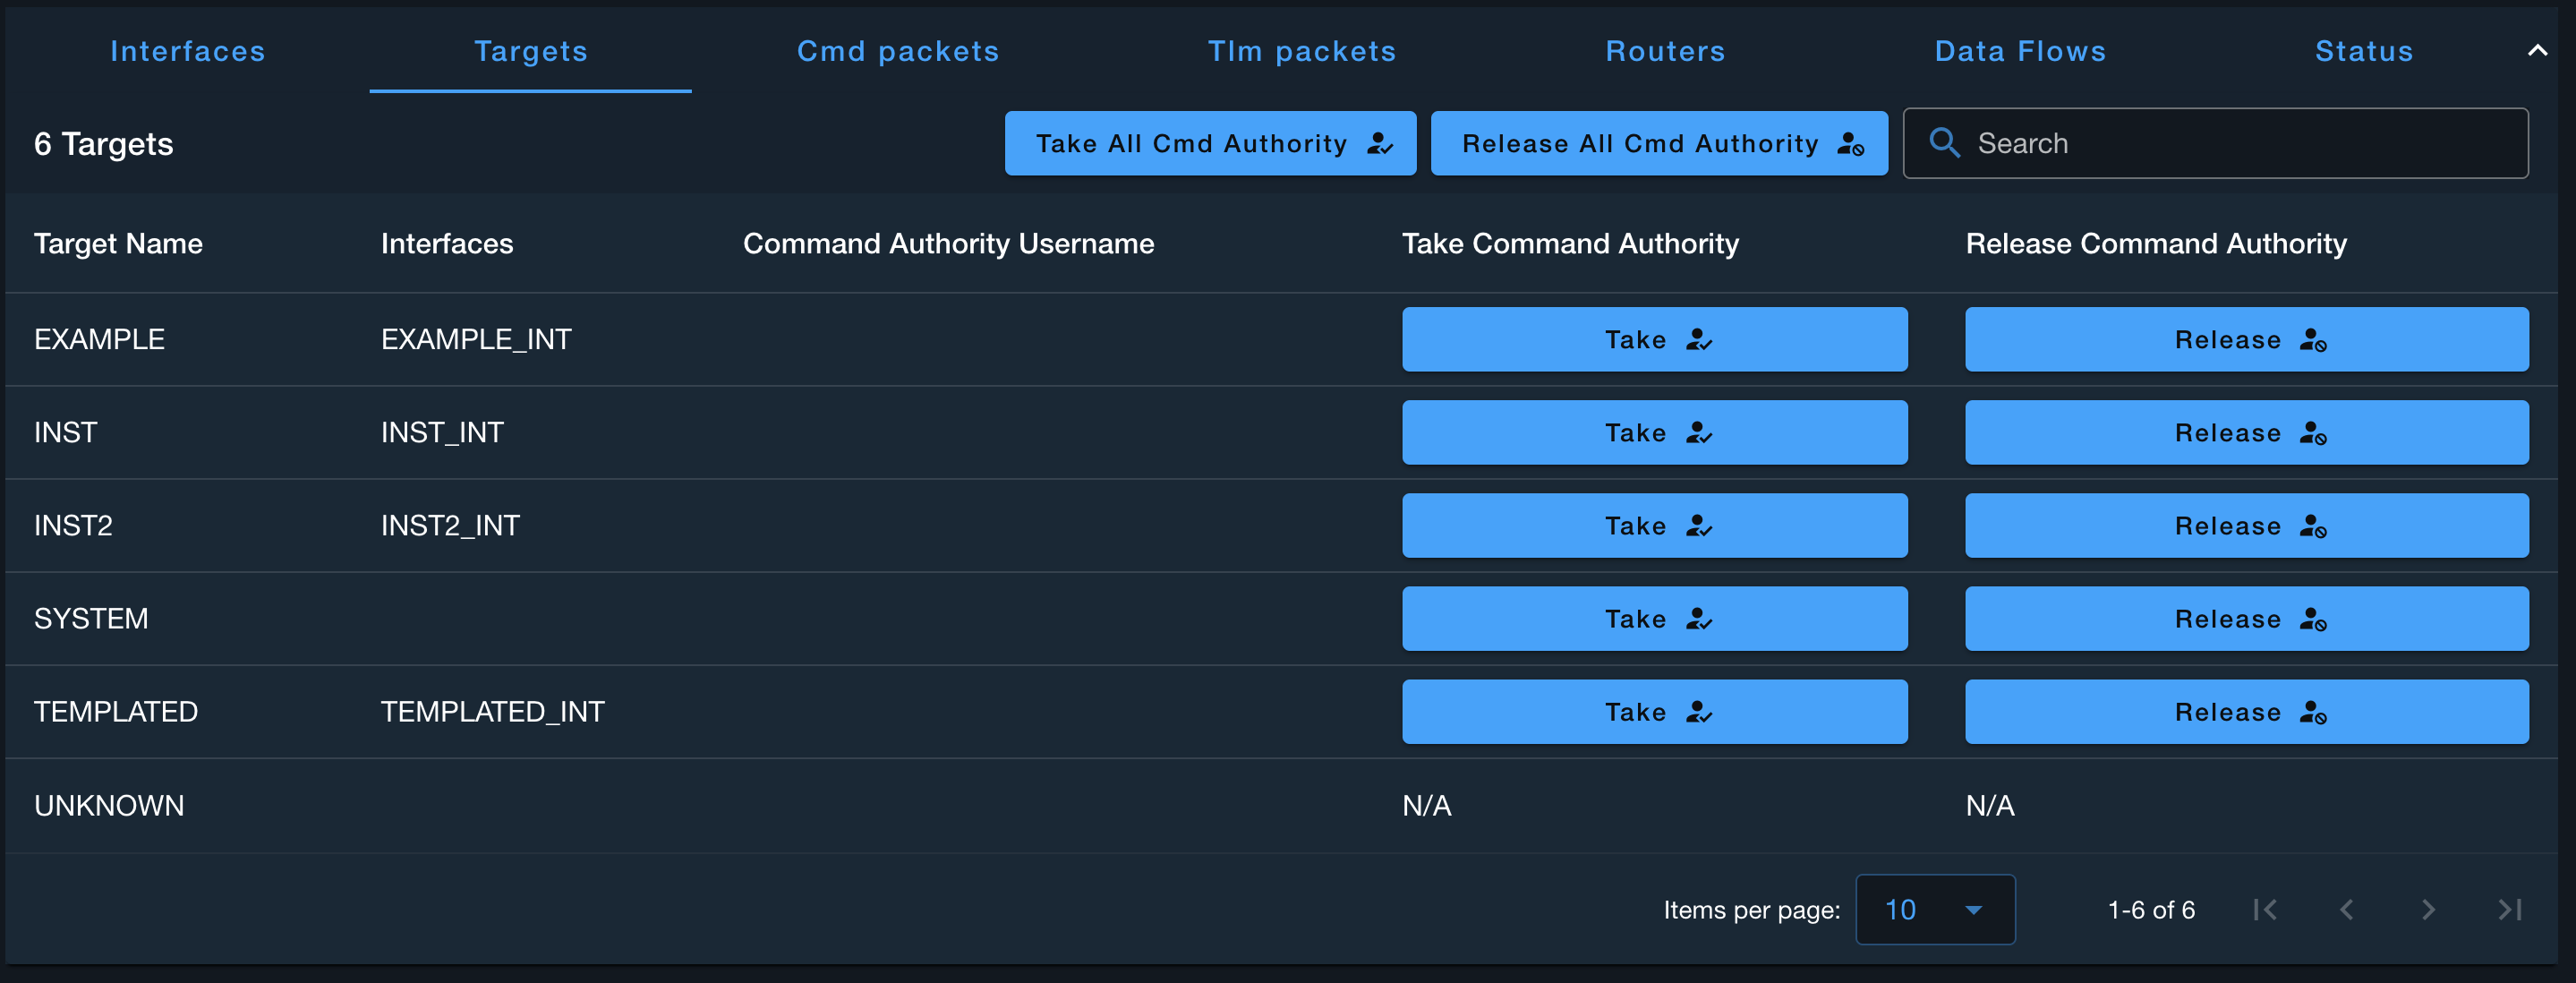
Command Authority (Enterprise) allows individual users to take and release Command Authority which enables exclusive command and script access to that target for that user. Without taking Command Authority, users can not send a command or start a script under that target. Note, commands or scripts scheduled with Calendar or Autonomic are not affected by Command Authority.
Command Authority, along with Critical Commanding (Enterprise), can be enabled in the Admin Console under the Scopes tab.
Command Packets Tab
The Command Packets tab displays all the available commands. The table can be sorted by clicking on the column headers. The table is paginated to support thousands of commands. The search bar searches all pages for a command.
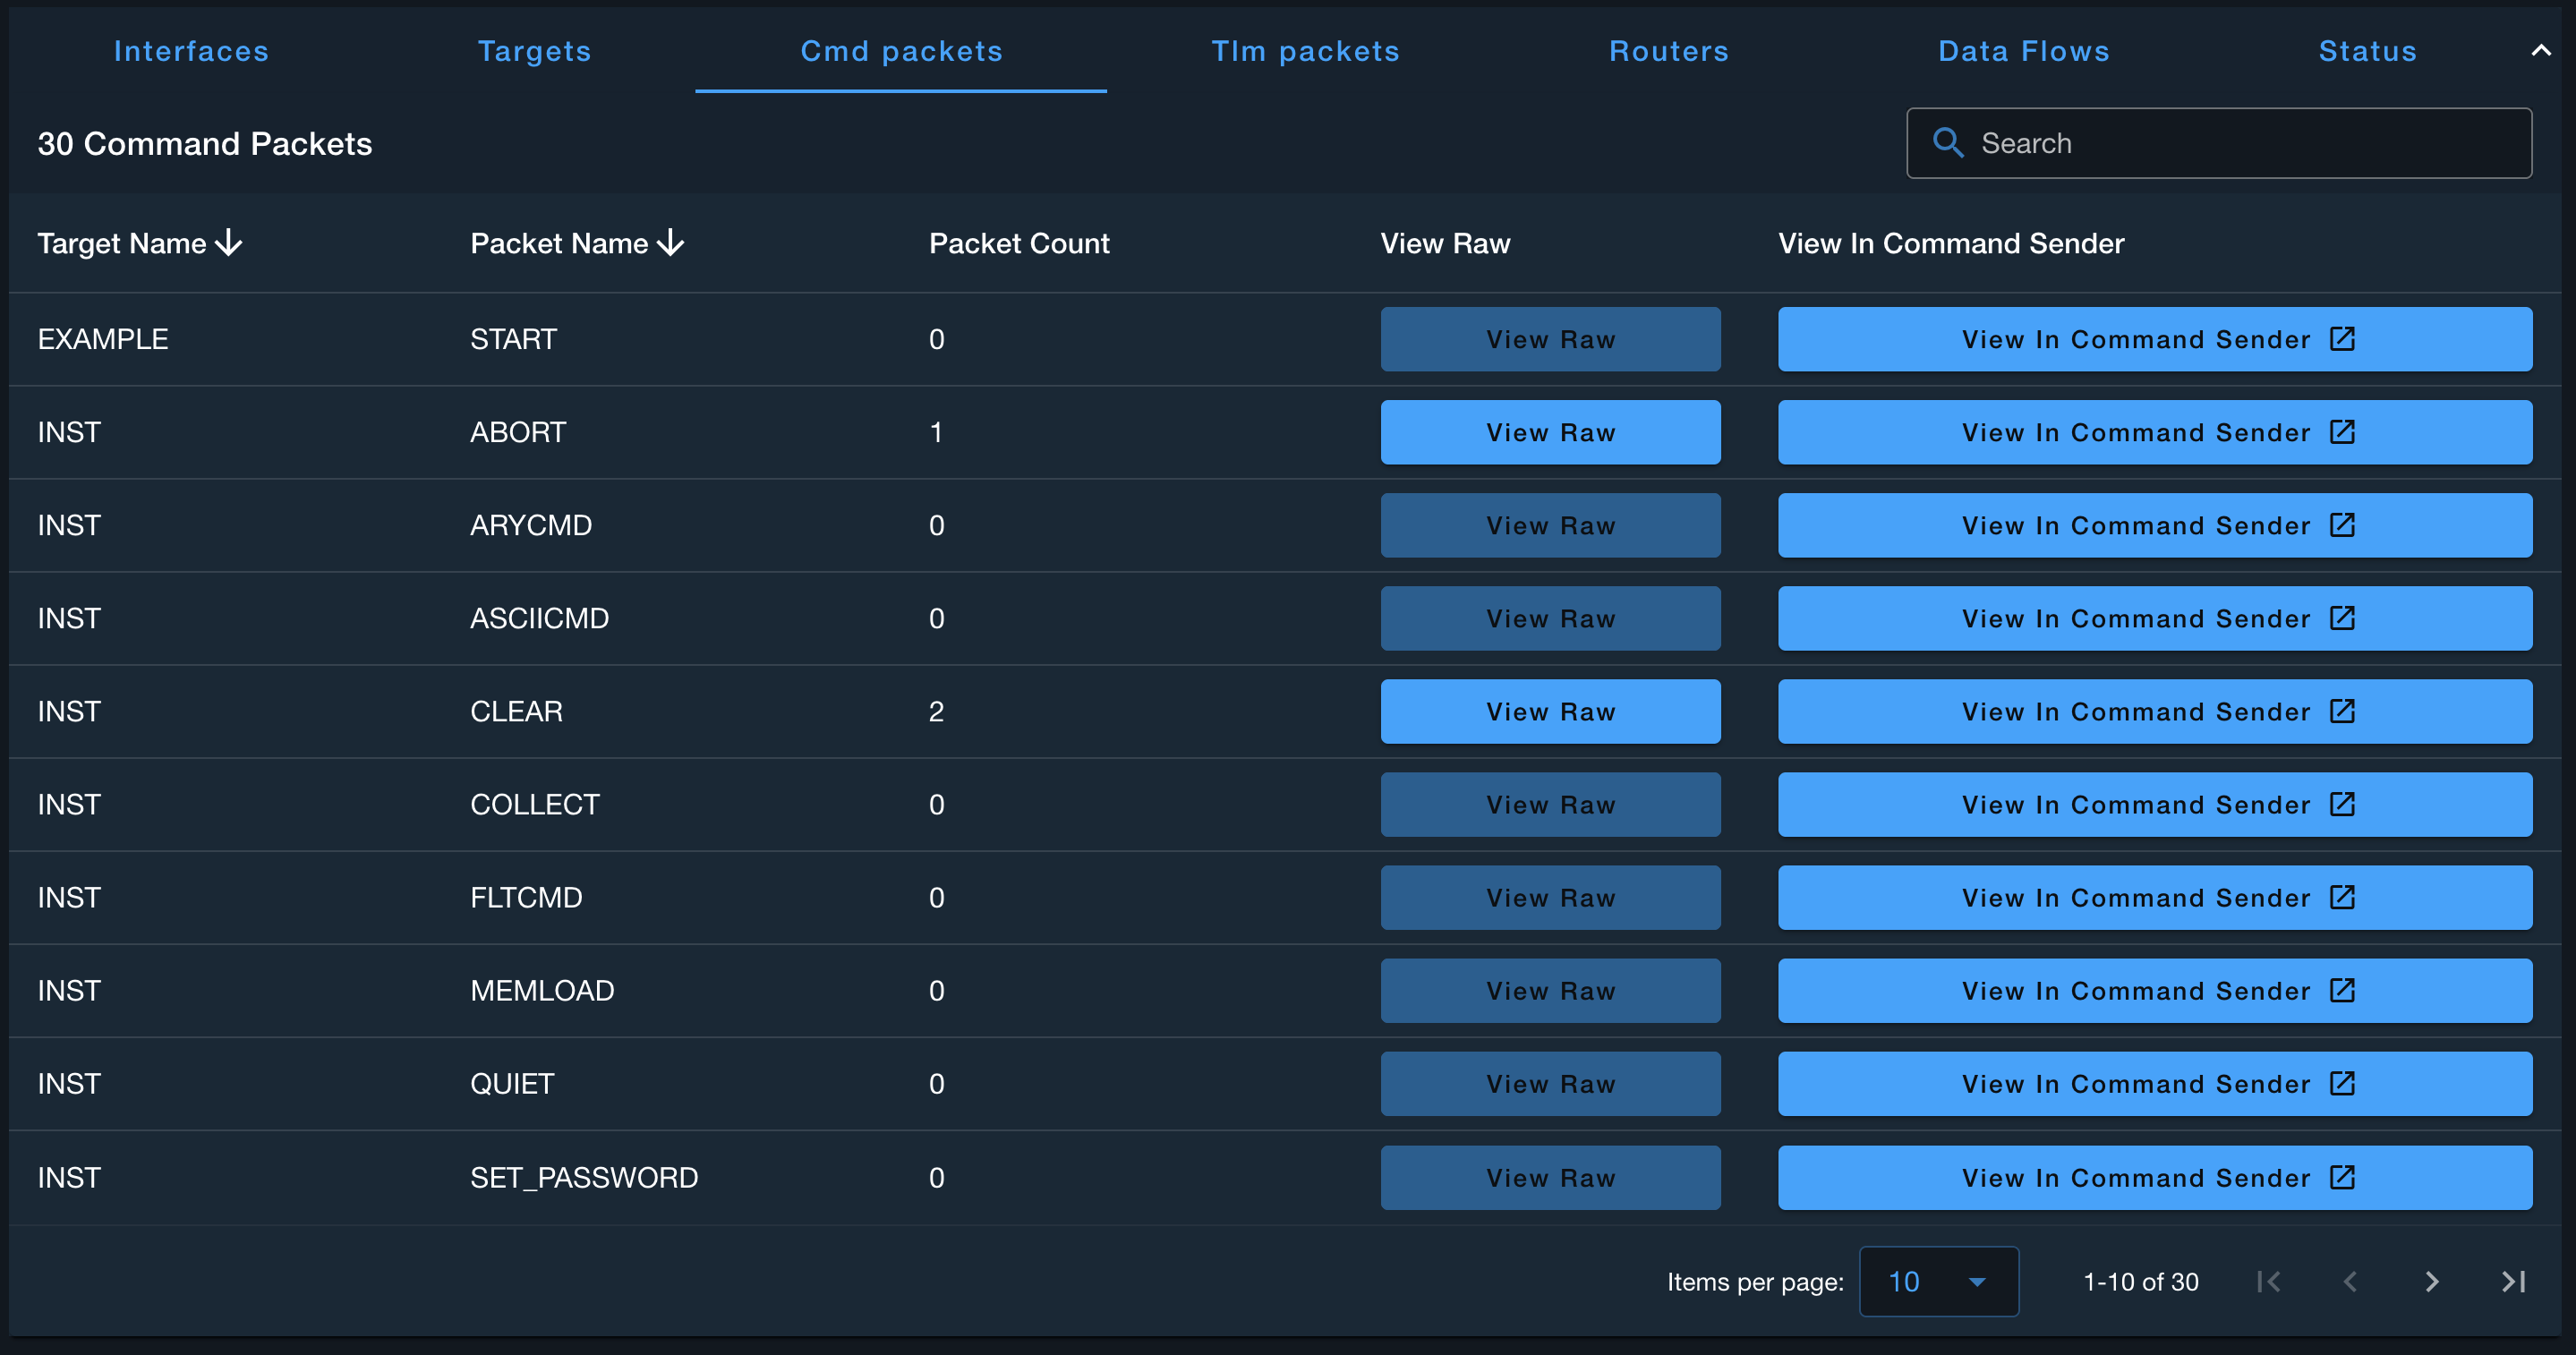
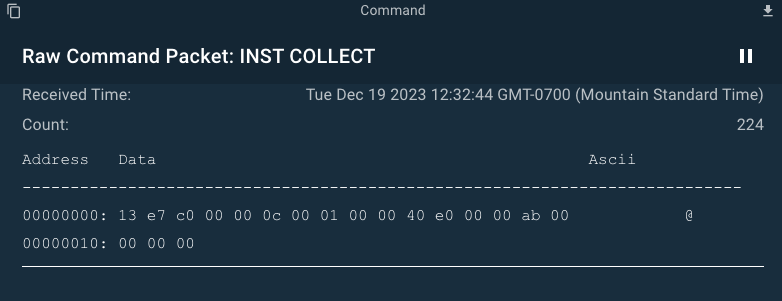
Clicking on View Raw opens a dialog displaying the raw bytes for that command.
Clicking View in Command Sender opens up a new Command Sender window with the specified command.
Telemetry Packets Tab
The Telemetry Packets tab displays all the available telemetry. The table can be sorted by clicking on the column headers. The table is paginated to support thousands of telemetry packets. The search bar searches all pages for a telemetry packet.
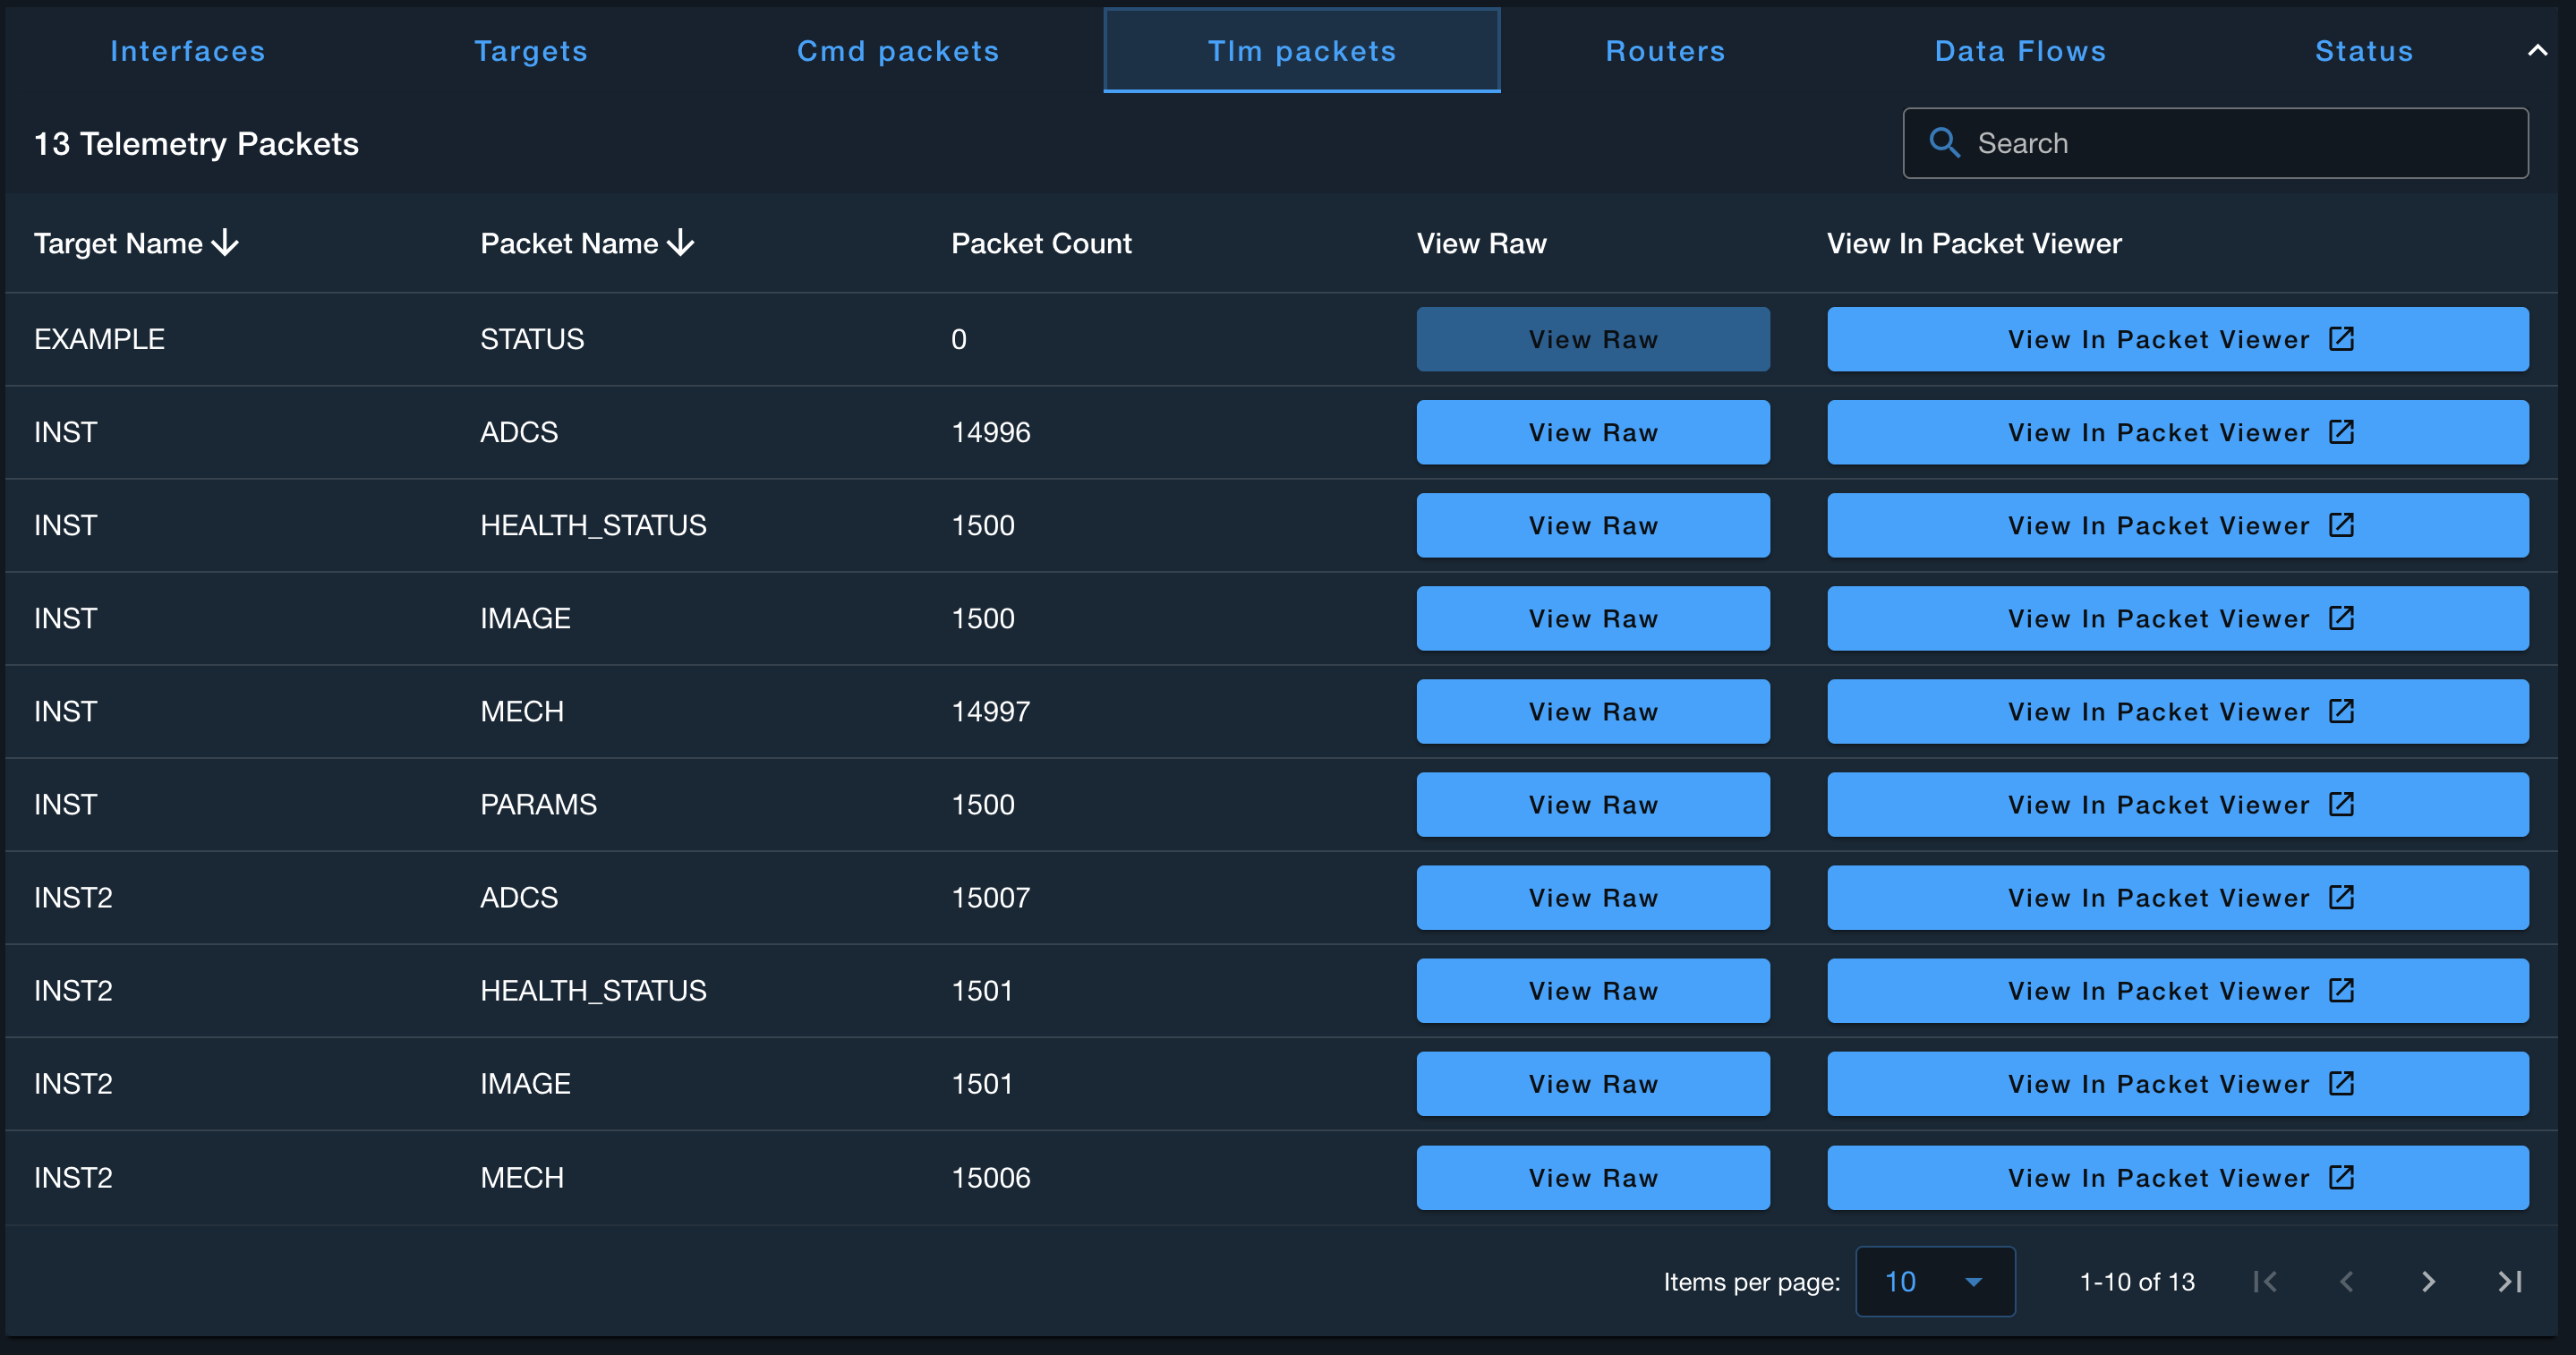
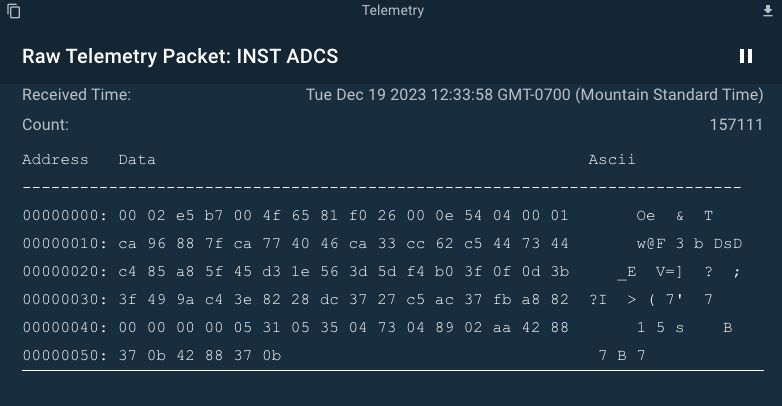
Clicking on View Raw opens a dialog displaying the raw bytes for that telemetry packet.
Clicking View in Packet Viewer opens up a new Packet Viewer window with the specified telemetry packet.
Data Flows Tab
The Data Flows tab displays all the Interface data flows through the system.
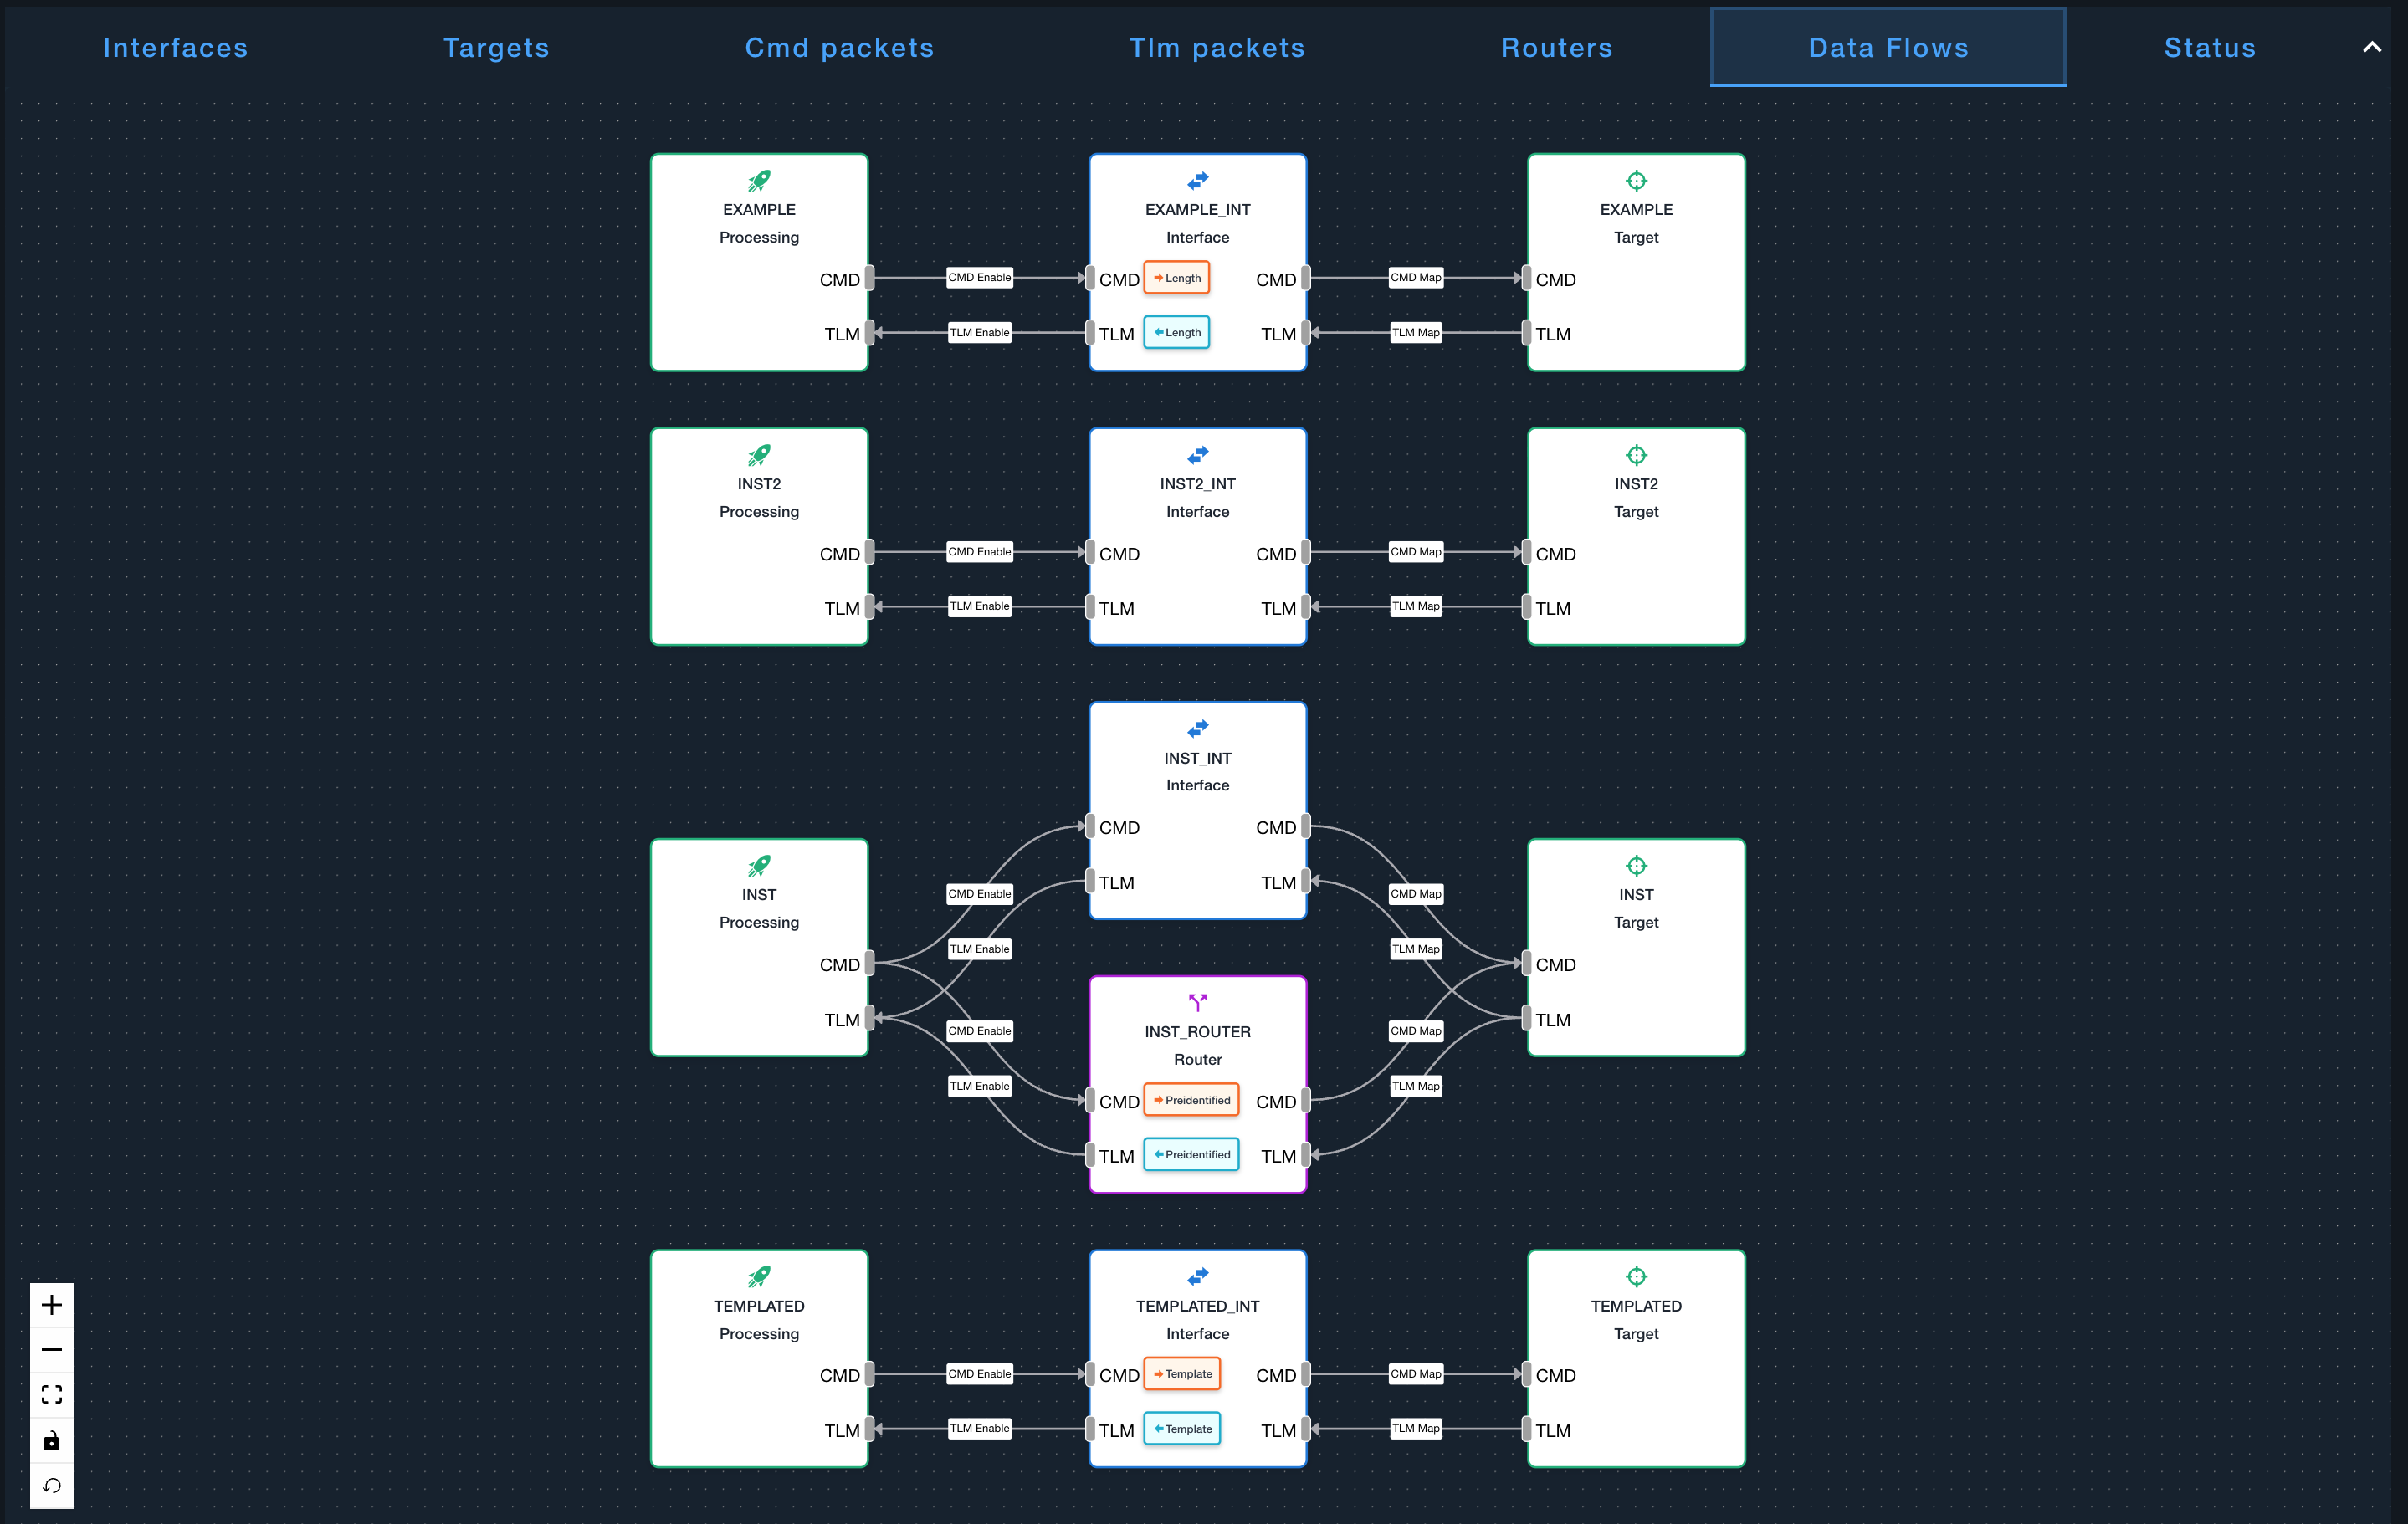
You can disconnect the interface from the COSMOS Processing by clicking and deleting the lines connecting the Processing to the Interface. This will leave the interface "connected" but no commands are sent out or telemetry processed. Removing the lines from the Interface to the Target will effectively "unmap" the interface and restart it. This may require re-installing the plugin to restore the interface.
From the Details dialog you can also view details about the individual Protocols applied to the Interface. In the EXAMPLE_INT Interface, when you click on the Length protocol you can see the details of the protocol.
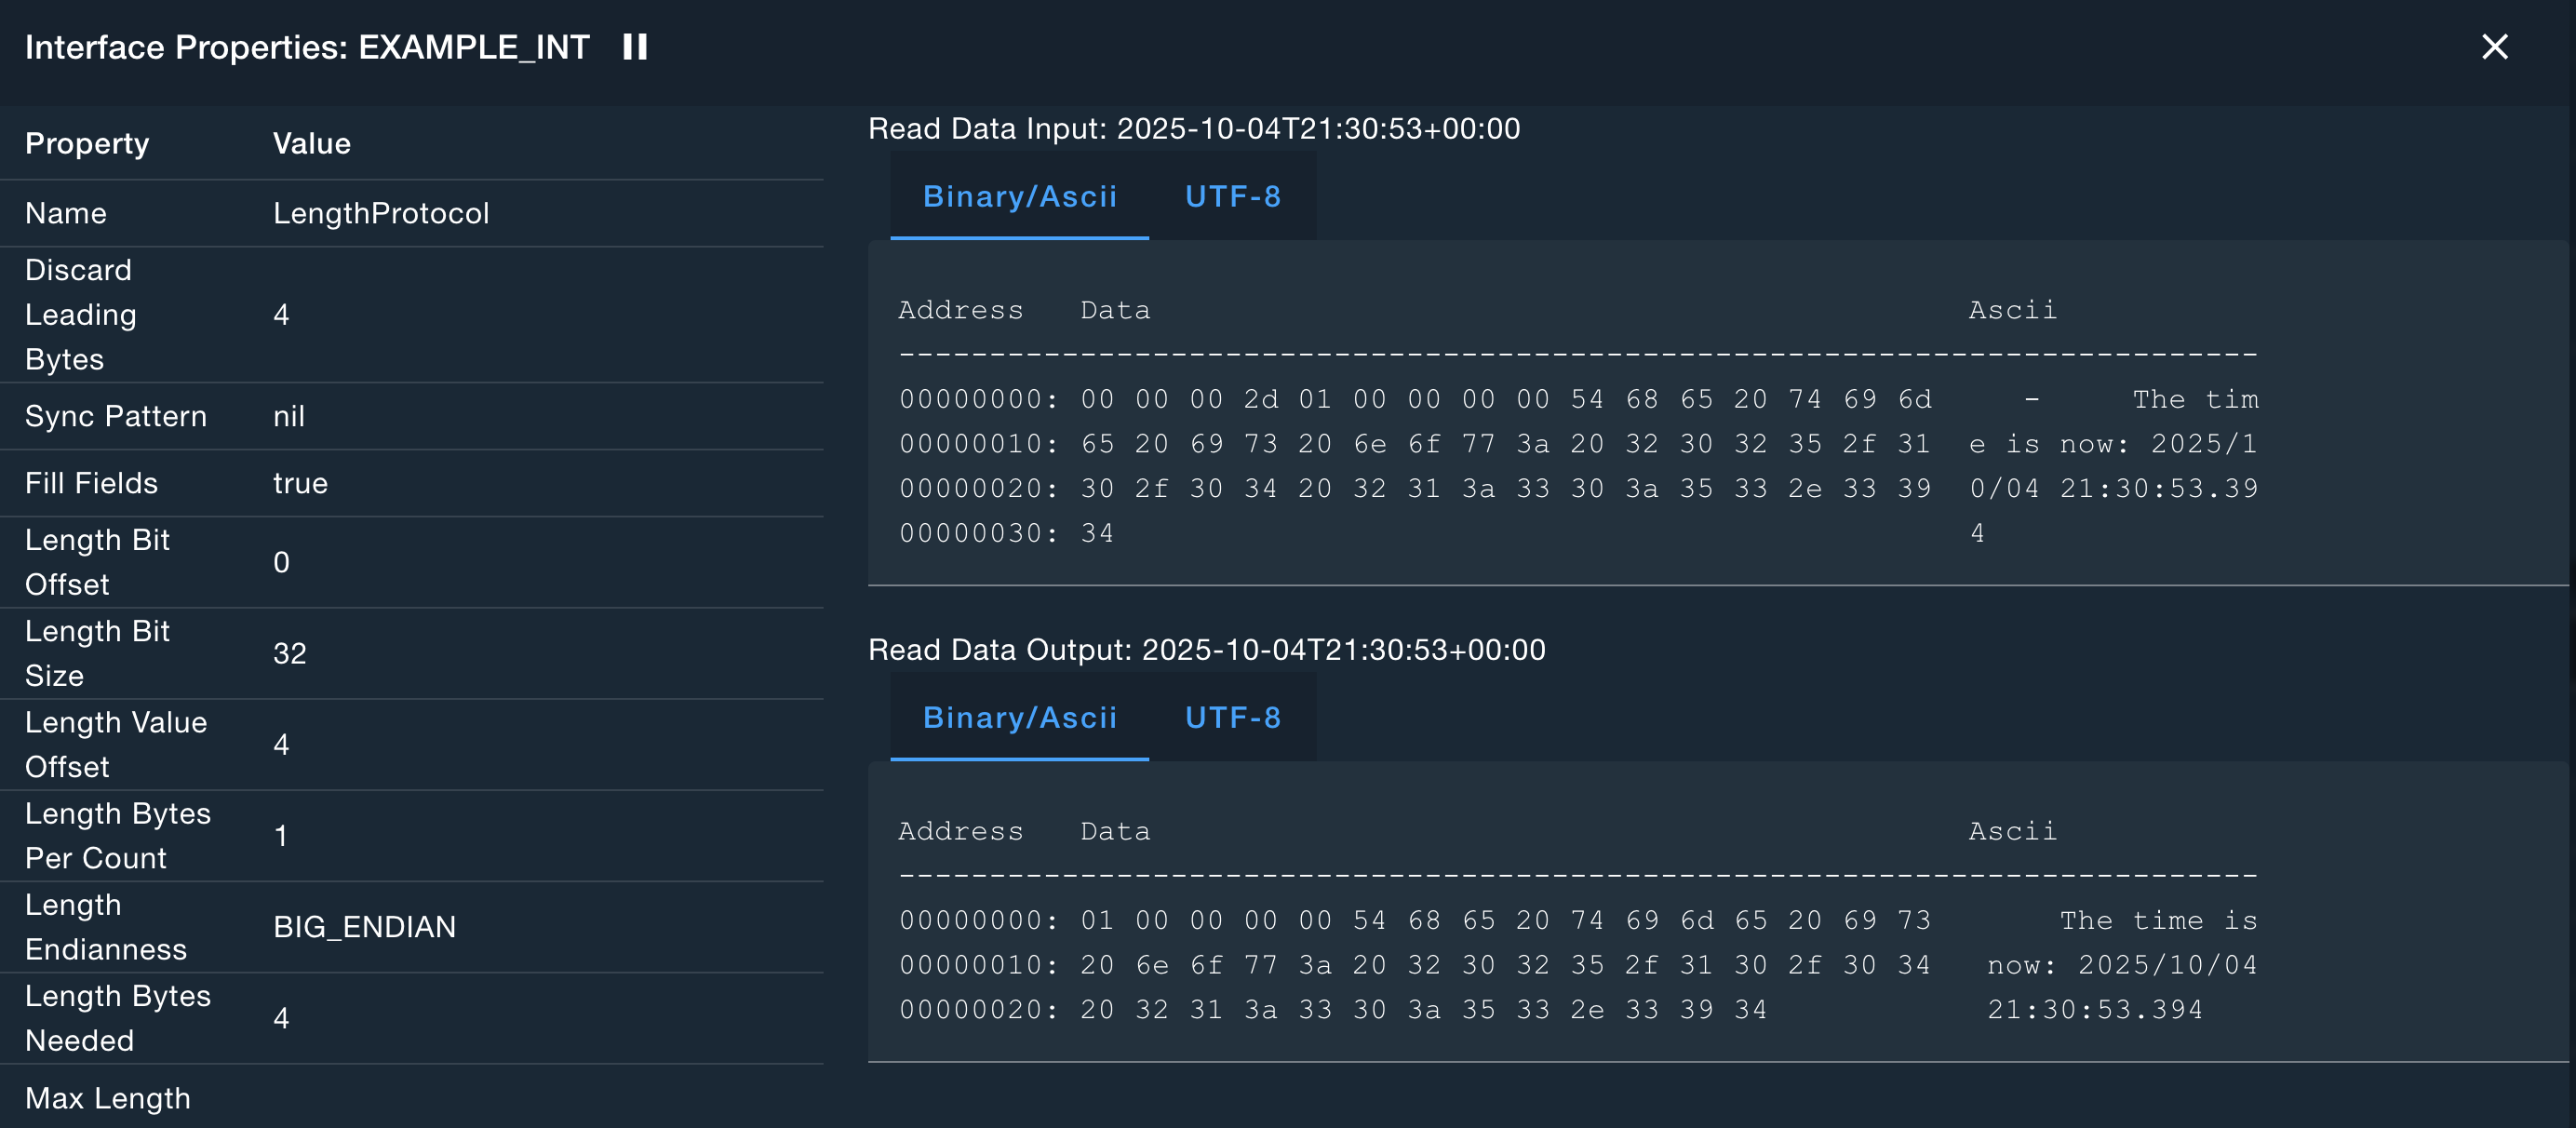
This dialog shows the various settings for the protocol as well as the raw data processed by the protocol.
Status Tab
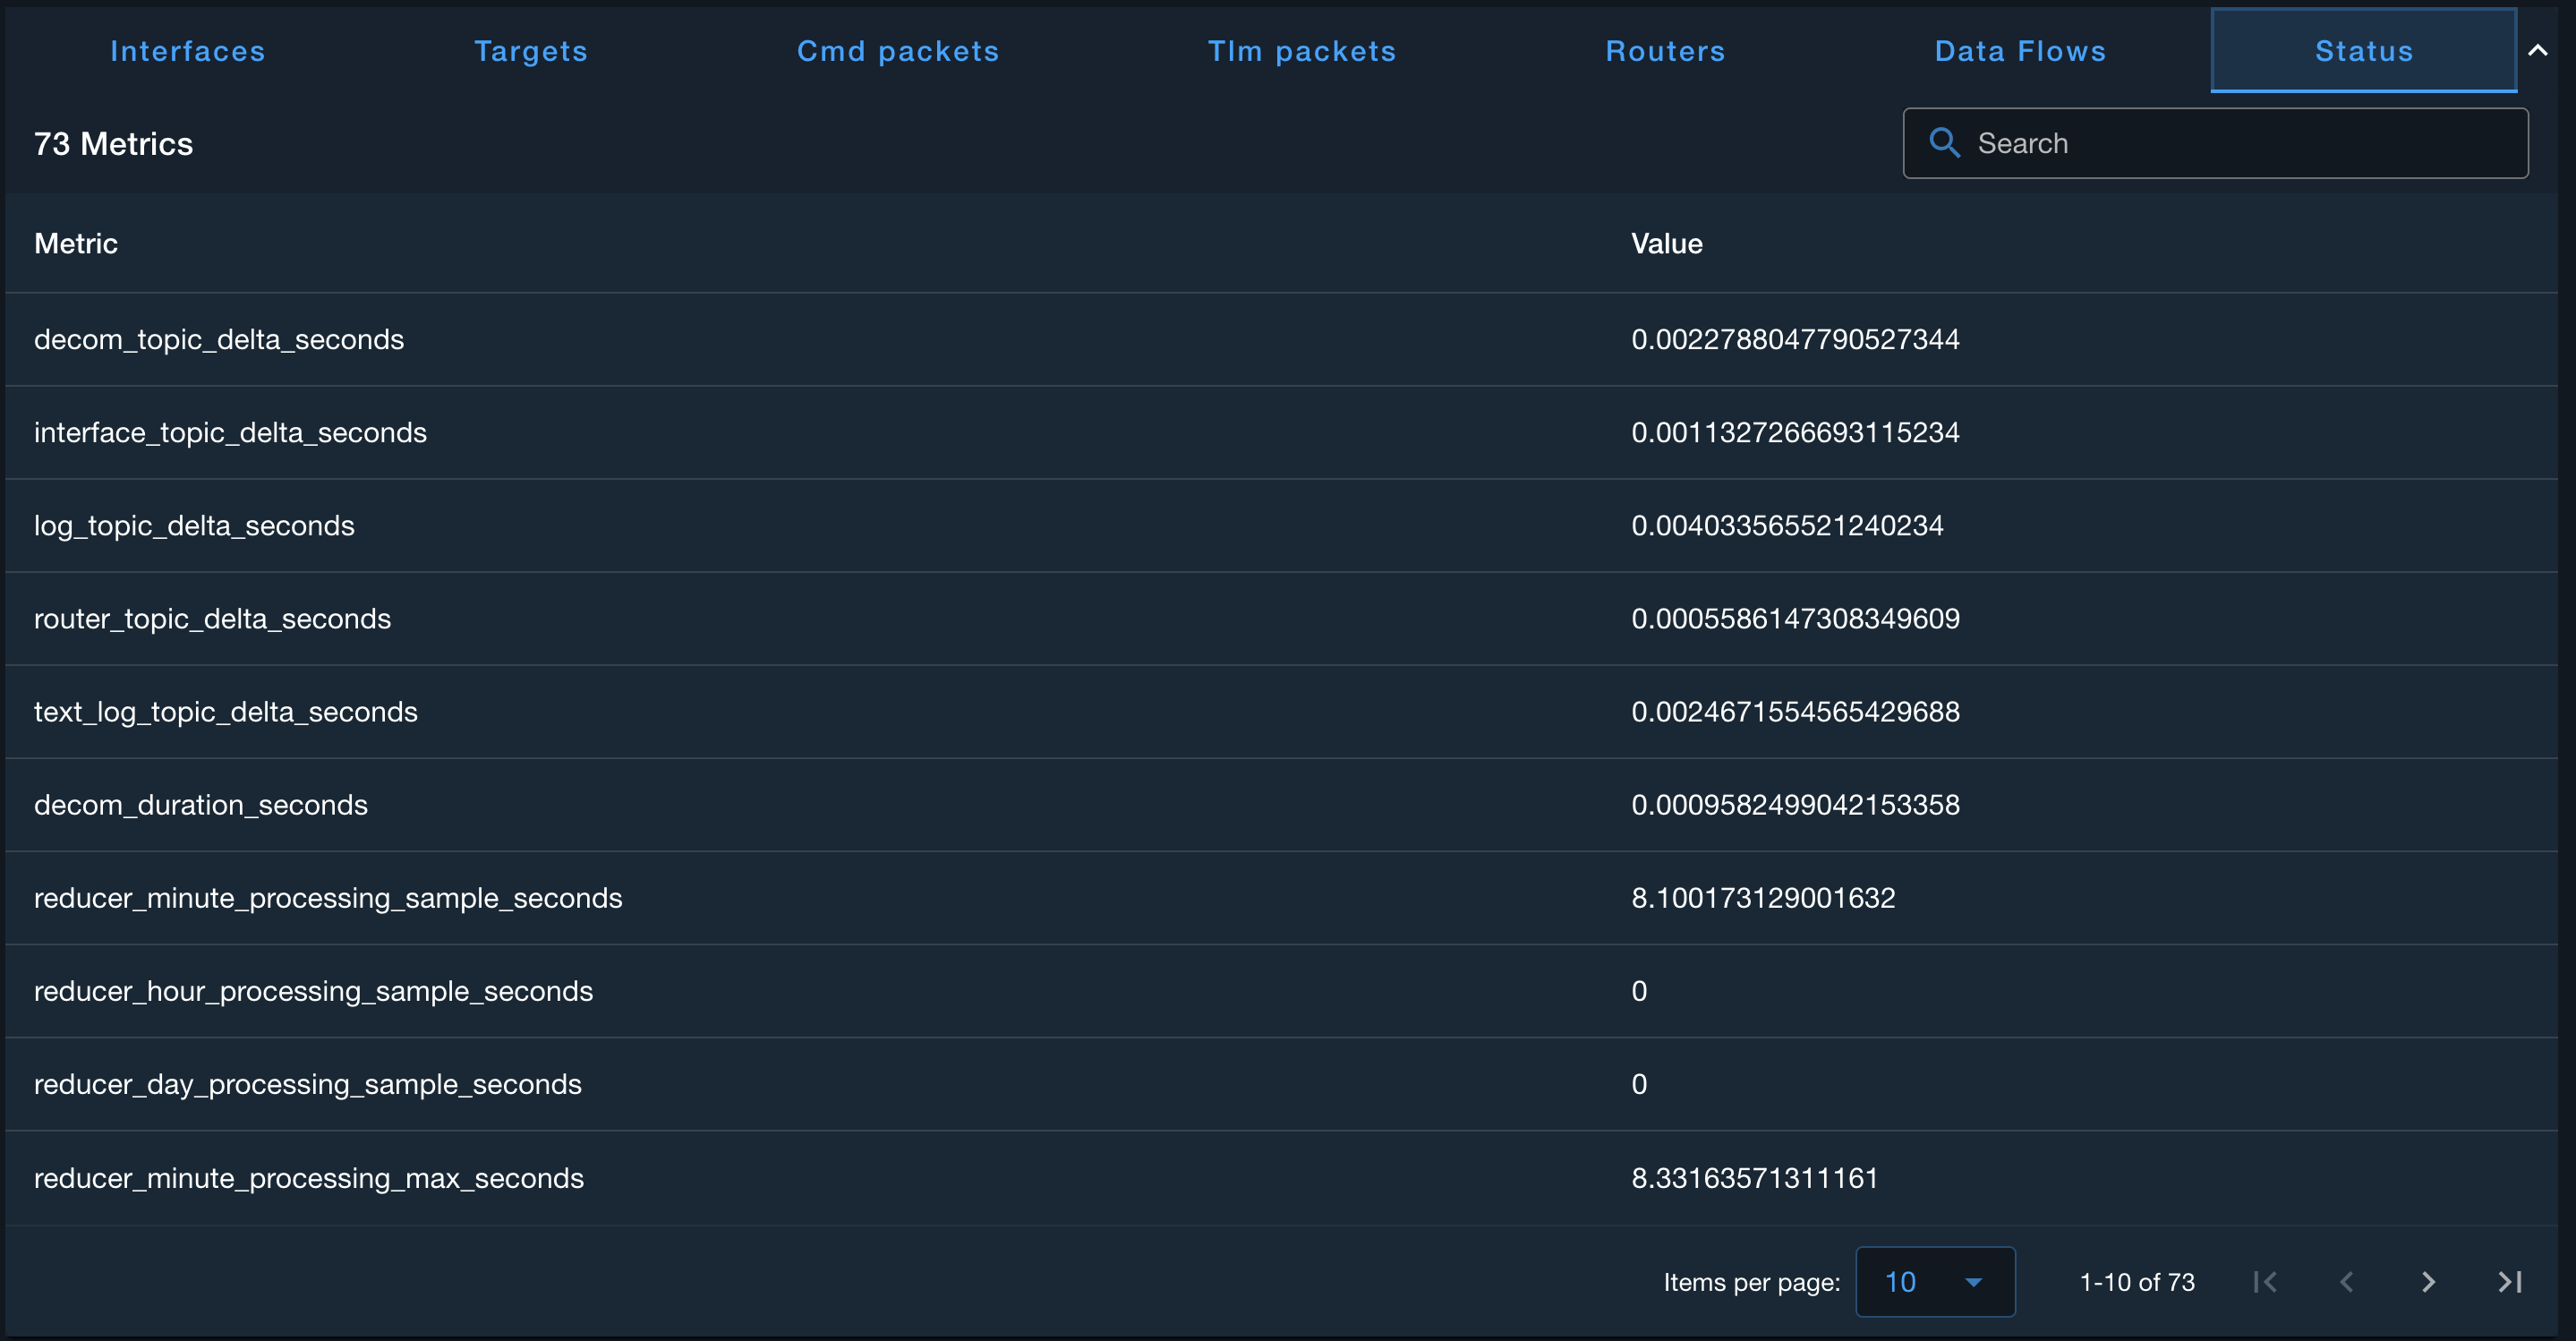
The Status tab displays COSMOS system metrics.
Log Messages
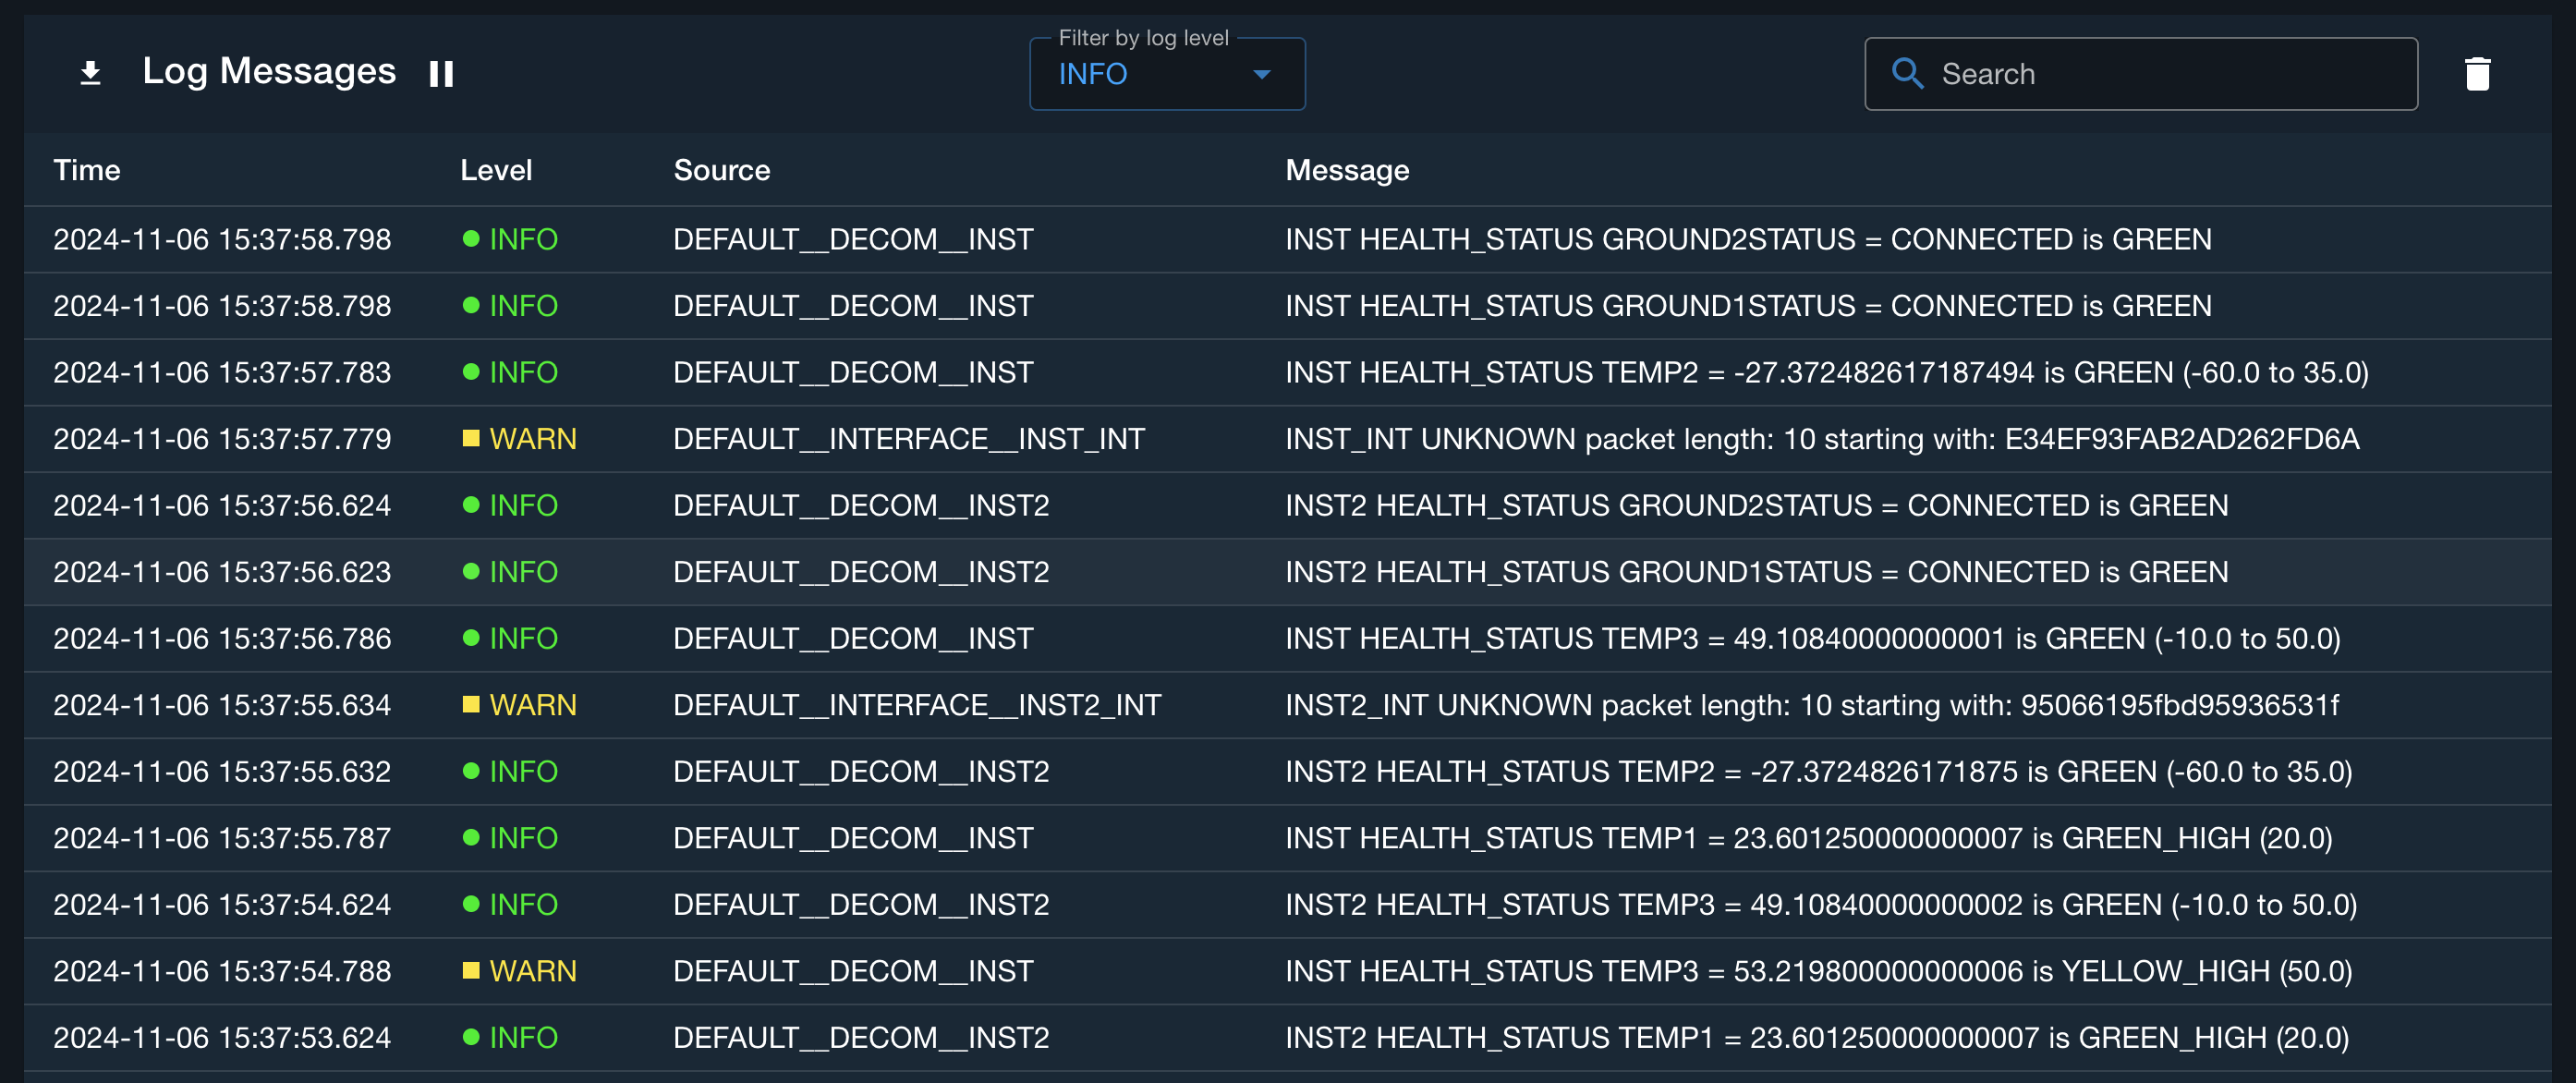
The Log Messages table sits below all the tabs in the Command and Telemetry Server application. It displays server messages such as limits events (new RED, YELLOW, GREEN values), logging events (new files) and interface events (connecting and disconnecting). It can be filtered by severity or by entering values in the Search box. It can also be paused and resumed to inspect an individual message.
